Fig. 5.
Download original image
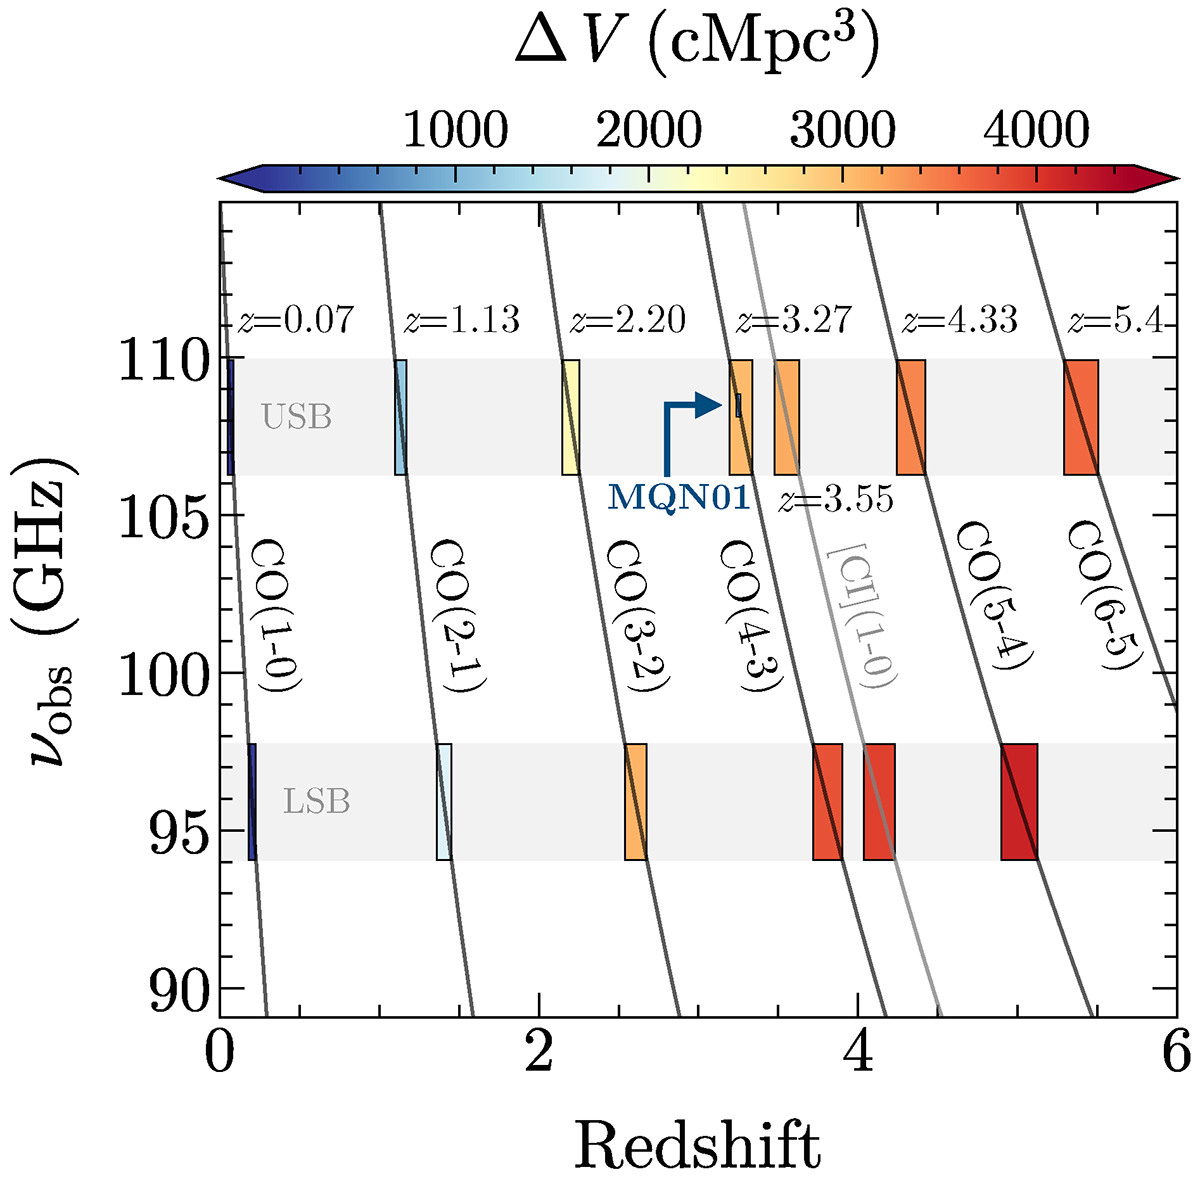
Observed frequency of CO and [CI]609 μm transitions as a function of redshift. The boxes encircle both the frequency and redshift ranges covered by our ALMA band 3 observations. Boxes are color-coded by the cosmological volume probed by each transitions. Gray bands show the SPW coverage in the LSB and USB. The mean redshift of transitions entering the USB are also reported. The blue arrow points to the box representing the volume within ±1000 km s−1 around the QSO CTS G18.01 systemic redshift.
Current usage metrics show cumulative count of Article Views (full-text article views including HTML views, PDF and ePub downloads, according to the available data) and Abstracts Views on Vision4Press platform.
Data correspond to usage on the plateform after 2015. The current usage metrics is available 48-96 hours after online publication and is updated daily on week days.
Initial download of the metrics may take a while.