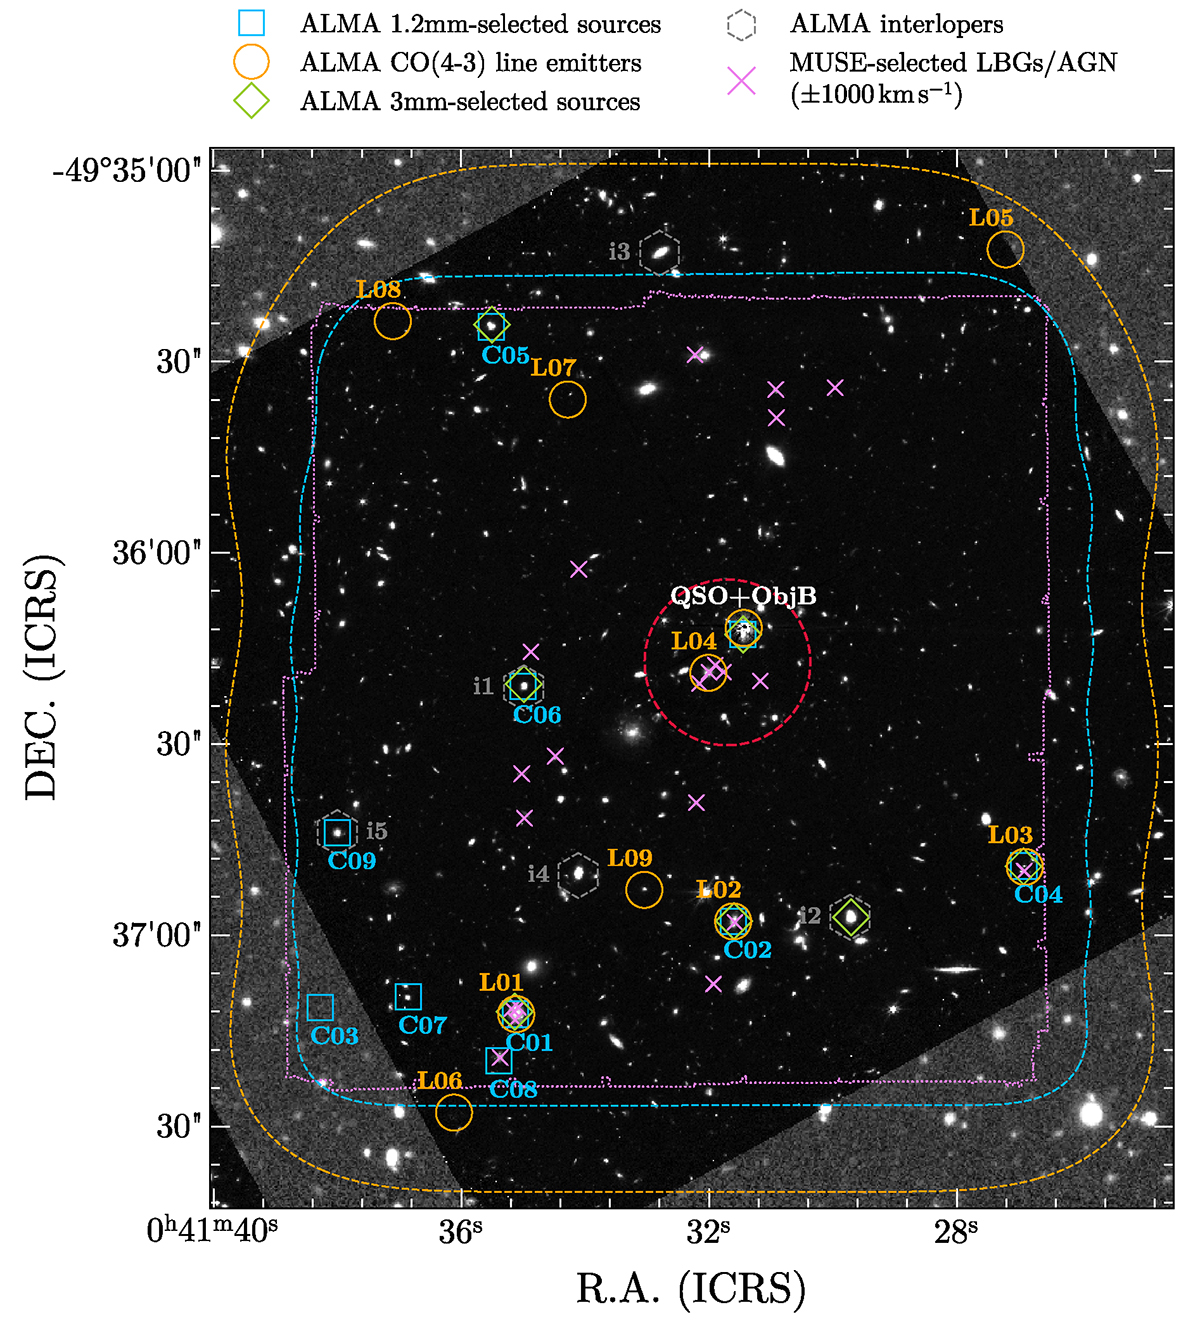
Fig. 2.
Download original image
Footprints of our ALMA and MUSE observations toward the MQN01 field. The orange and blue contours encircle the area where the combined mosaic PB response is ≥0.5 for ALMA band 3 and 6, respectively. Within these areas we performed the source search. Violet contour draws the MUSE footprint. The background is a composition of the JWST NIRCam F322W2 image (center and southeast corner) complemented with the VLT/FORS2 R-band observation (northeast, northwest, and southwest corners, and the southeast gap between the JWST NIRCam detectors). The point-spread-function-like emission of QSO CTS G18.01 has been subtracted in the JWST image revealing a nearby southeast quasar companion (Object B). Orange circles and blue squares indicate the locations of the ALMA CO(4–3) line-emitting and 1.2 mm continuum-selected sources in our ALMA band 3 and 6 observations, respectively. Green squares pin-point galaxy candidates detected in continuum at 3 mm in ALMA band 3. Gray hexagons denote sources corresponding to low-z counterparts, all but i5 show bright emission line in ALMA band 3. Violet crosses are the MUSE-selected LBGs belonging within ±1000 km s−1 of the QSO CTS G18.01 systemic redshift. The dashed red circle shows the inner 100 pkpc around the estimated center of the protocluster core.
Current usage metrics show cumulative count of Article Views (full-text article views including HTML views, PDF and ePub downloads, according to the available data) and Abstracts Views on Vision4Press platform.
Data correspond to usage on the plateform after 2015. The current usage metrics is available 48-96 hours after online publication and is updated daily on week days.
Initial download of the metrics may take a while.