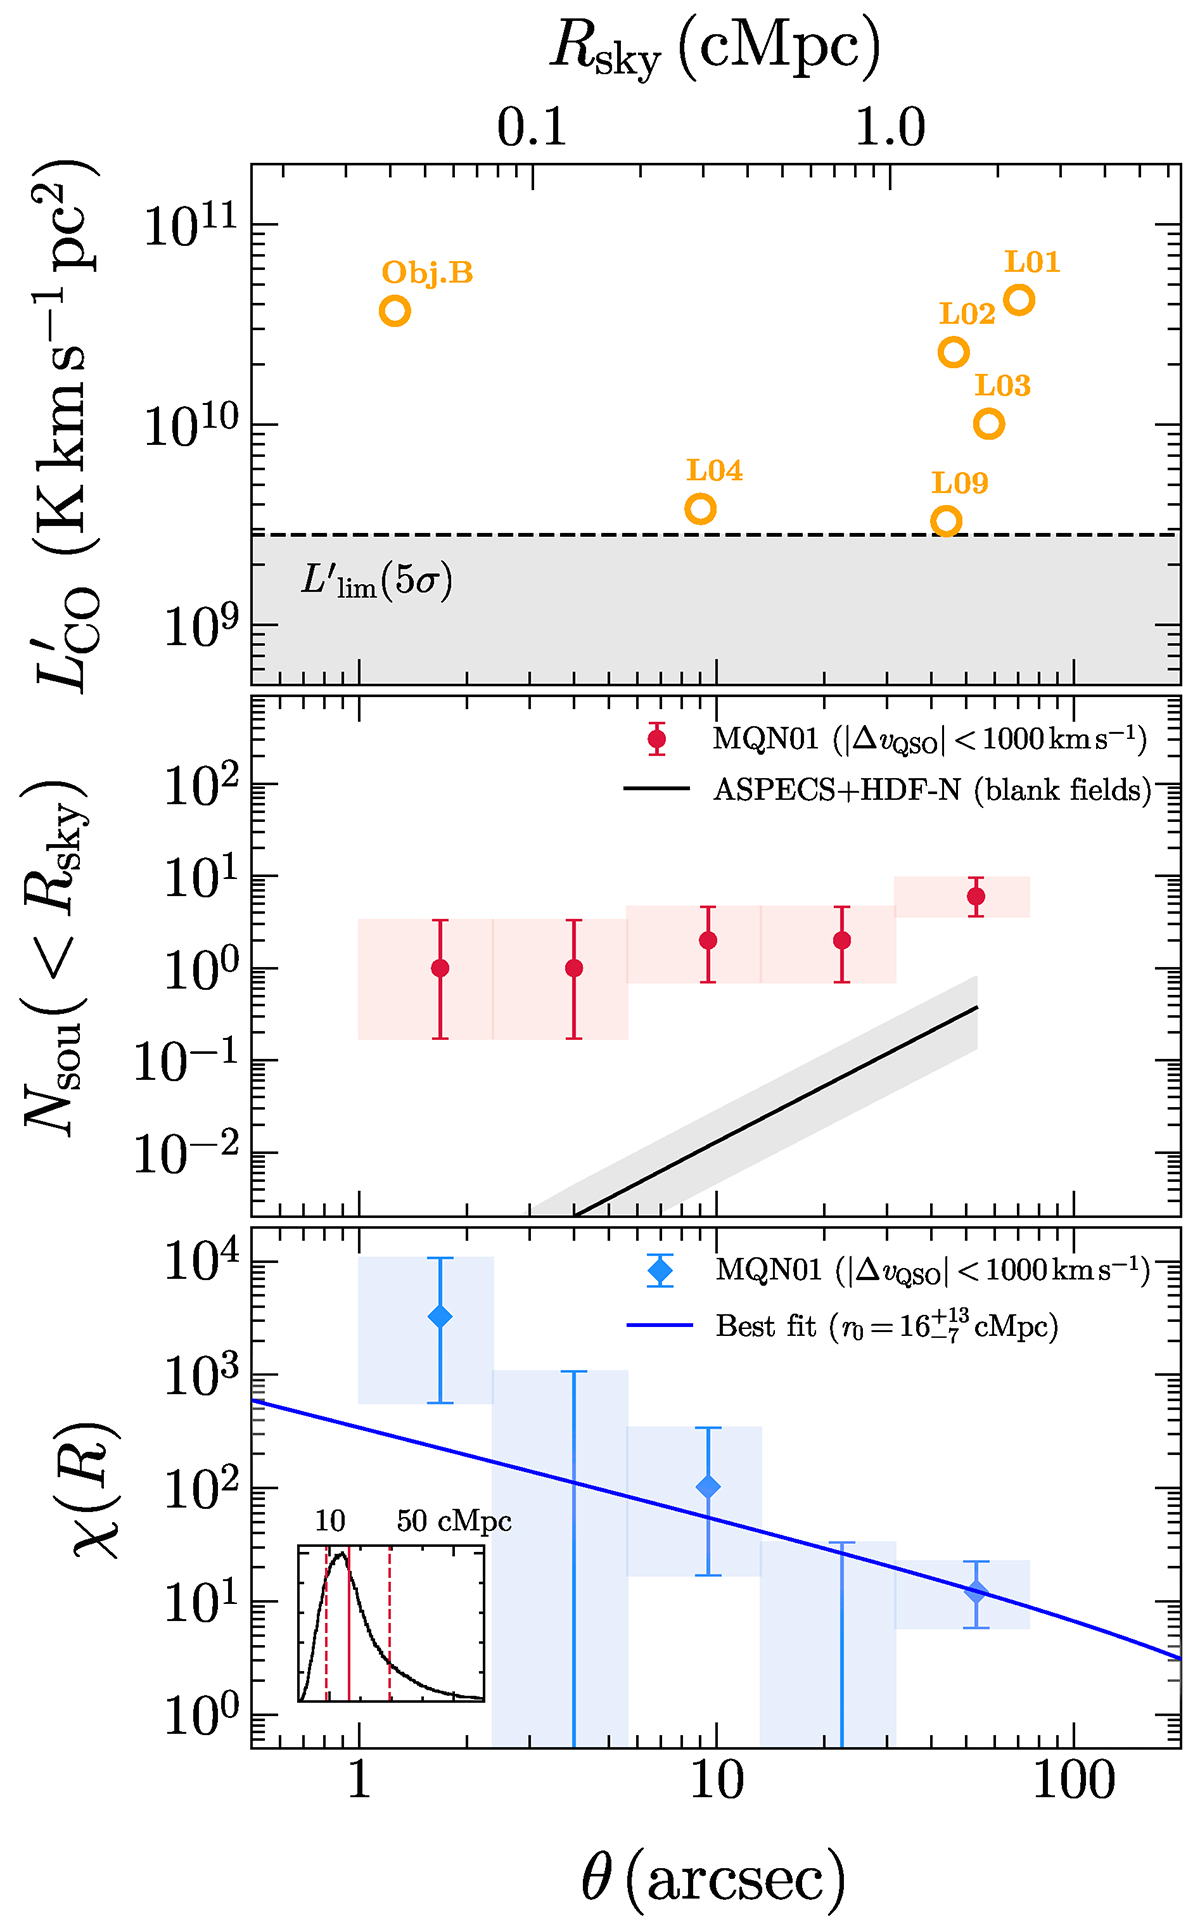
Fig. B.1.
Download original image
Estimation of the cross-correlation length in MQN01. Top panel: Source CO line luminosities as a function of radial distance from the central quasar. The gray band shows the 5σ limiting luminosities of our survey (see text for further details). Central panel: Cumulative source number counts in MQN01 (red bins) and that expected in blank fields (black line, with their uncertainties shown in gray). Bottom panel: Projected volume-integrated cross correlation function in MQN01 (blue bins), the best-fit model (solid blue line), and the random draw from our Monte Carlo simulation (in gray). The inset panel shows the posterior distribution of the three-dimensional cross-correlation length with red lines indicating the 16th, 50th, and 84th percentile, respectively.
Current usage metrics show cumulative count of Article Views (full-text article views including HTML views, PDF and ePub downloads, according to the available data) and Abstracts Views on Vision4Press platform.
Data correspond to usage on the plateform after 2015. The current usage metrics is available 48-96 hours after online publication and is updated daily on week days.
Initial download of the metrics may take a while.