Fig. 12.
Download original image
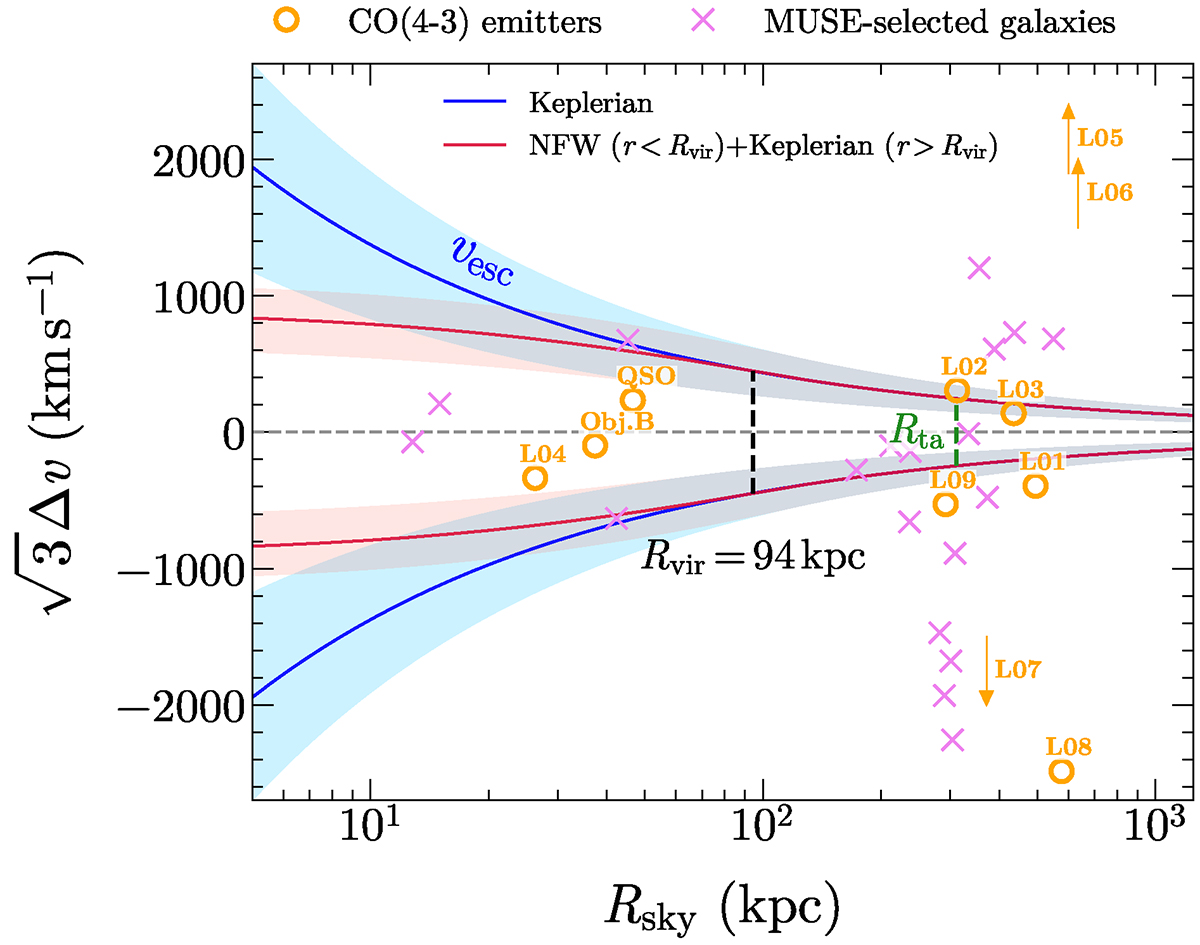
Estimated three-dimensional galaxy velocities (including a statistical correction factor of ![]() assuming dynamical symmetry) as a function of the projected separation with respect to the estimated halo center (also shown in Fig. 2). The CO(4–3)-line emitting galaxies and those with high-fidelity spectroscopic redshift from MUSE within |ΔvQSO|< 4000 km s−1 are indicated by orange circles and violet crosses, respectively. The arrows indicate sources that lie outside the reported velocity range. The vertical dashed black and green lines mark the estimated virial (Rvir) and “turnaround” radius (Rta). The blue and red curves are the predicted escape velocity corresponding to a central point-like object and a truncated NFW mass profile, respectively with a total mass equal to the estimated M200. The shaded areas report the 1σ uncertainties. Galaxies that fall within the virial radius and the envelope are expected to be gravitationally bound.
assuming dynamical symmetry) as a function of the projected separation with respect to the estimated halo center (also shown in Fig. 2). The CO(4–3)-line emitting galaxies and those with high-fidelity spectroscopic redshift from MUSE within |ΔvQSO|< 4000 km s−1 are indicated by orange circles and violet crosses, respectively. The arrows indicate sources that lie outside the reported velocity range. The vertical dashed black and green lines mark the estimated virial (Rvir) and “turnaround” radius (Rta). The blue and red curves are the predicted escape velocity corresponding to a central point-like object and a truncated NFW mass profile, respectively with a total mass equal to the estimated M200. The shaded areas report the 1σ uncertainties. Galaxies that fall within the virial radius and the envelope are expected to be gravitationally bound.
Current usage metrics show cumulative count of Article Views (full-text article views including HTML views, PDF and ePub downloads, according to the available data) and Abstracts Views on Vision4Press platform.
Data correspond to usage on the plateform after 2015. The current usage metrics is available 48-96 hours after online publication and is updated daily on week days.
Initial download of the metrics may take a while.