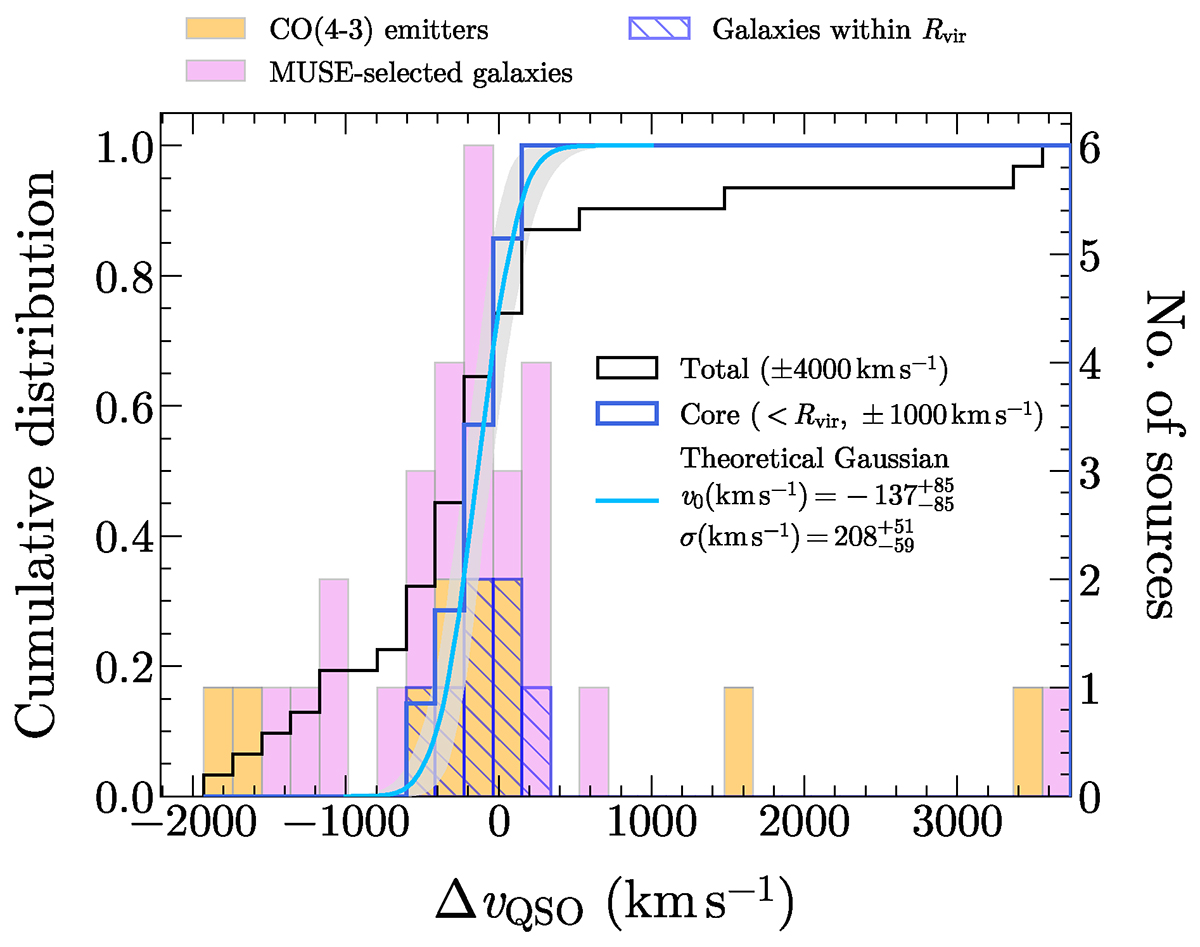
Fig. 11.
Download original image
Distributions of galaxy line-of-sight velocities in the MQN01 field. Right axis: Velocity distribution of galaxies in the MQN01 field either detected in their CO(4–3) lines in our ALMA band 6 survey (orange bins) or having high-fidelity spectroscopic redshift within |ΔvQSO|< 4000 km s−1 measured from MUSE data (violet bins). The blue hatched bins are the distribution of galaxy velocities in the core. Left axis: Cumulative distribution of the whole sample and that of the core (black and blue lines, respectively). The light blue curve is the theoretical prediction for a Gaussian distribution of velocities with central value and dispersion as reported in the legend. The gray band represents the 1σ confidence interval.
Current usage metrics show cumulative count of Article Views (full-text article views including HTML views, PDF and ePub downloads, according to the available data) and Abstracts Views on Vision4Press platform.
Data correspond to usage on the plateform after 2015. The current usage metrics is available 48-96 hours after online publication and is updated daily on week days.
Initial download of the metrics may take a while.