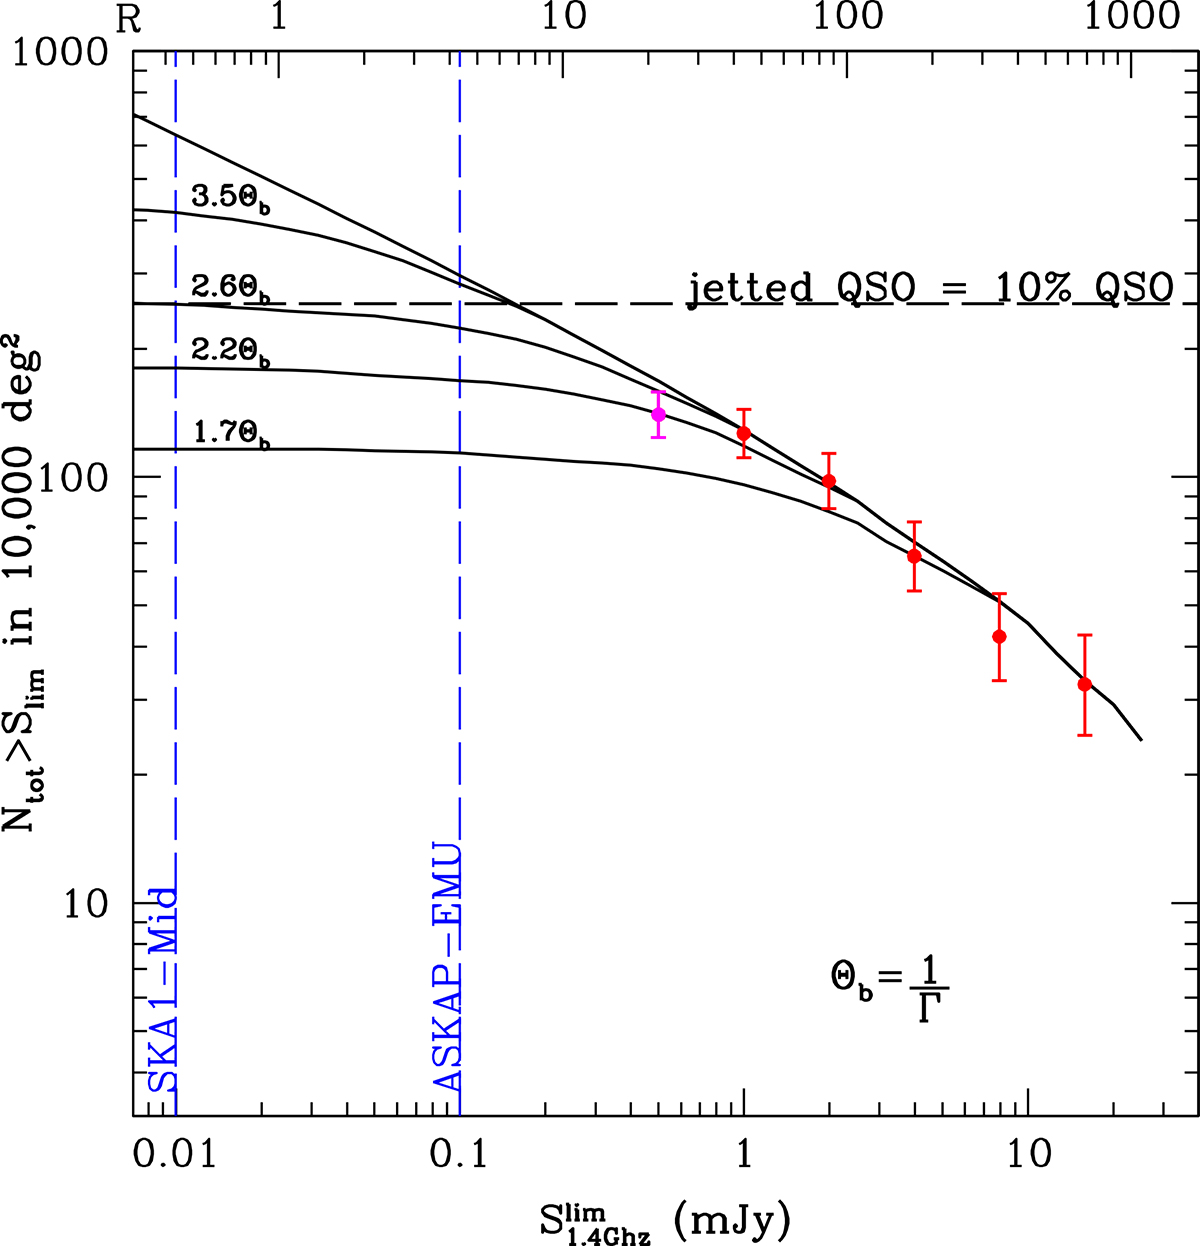
Fig. 4.
Download original image
Same as Fig. 3 but showing the impact of a circumnuclear obscuring torus with different aperture angles expressed in units of beaming angle Θb = 1/Γ (the uppermost line represents the case of no absorption). The upper scale of the figure shows the representative values of radio loudness (R) corresponding to the flux density limit in the X-axis and using a magnitude of 21 and assuming an average redshift of 4.5. The depth (5 × rms) of some ongoing and/or planned surveys is also indicated. The points are as in the previous figure. The horizontal dashed line indicates the expected total number of jetted QSOs in 10 000 sq. degrees if they represent 10% of the total QSO population.
Current usage metrics show cumulative count of Article Views (full-text article views including HTML views, PDF and ePub downloads, according to the available data) and Abstracts Views on Vision4Press platform.
Data correspond to usage on the plateform after 2015. The current usage metrics is available 48-96 hours after online publication and is updated daily on week days.
Initial download of the metrics may take a while.