Fig. 3.
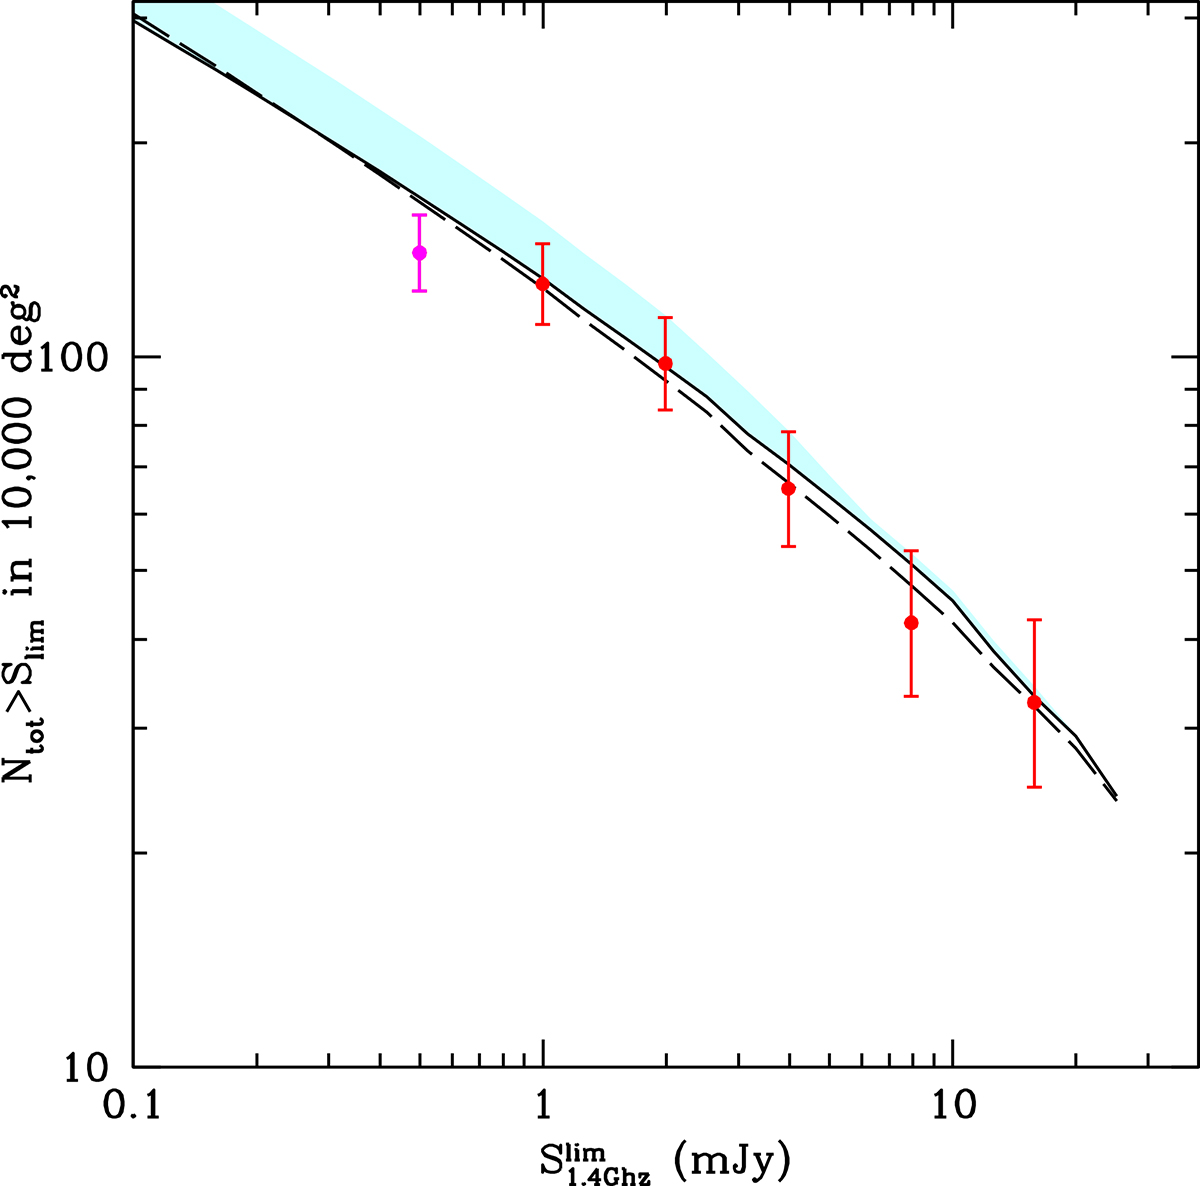
Download original image
Predicted number on a sky area of 10 000 sq. degrees of z ≥ 4 jetted type 1 QSOs (blazars+misaligned sources) with magdrop ≤ 21 for different radio flux density limits based on the high-z blazars currently detected at 1.4 GHz in the FIRST sample (mostly at flux densities above 10 mJy) described in the text. The predictions (black solid line) assume the best value of p (3.3). The light blue-shaded area indicates the possible impact of the sources with missing classification under the (extreme) assumption that all the sources missing X-ray data and with a radio loudness above 80 are blazars. The dashed line shows the impact of the misclassifications; the line was computed by excluding all blazars that have not been confirmed by VLBI observation (see Appendix B). In this case, we assume p = 3.0. The red points represent the observed sources from the FIRST catalogue, while the magenta point indicates the extension down to the 0.5 mJy beam−1 based on FIRST maps.
Current usage metrics show cumulative count of Article Views (full-text article views including HTML views, PDF and ePub downloads, according to the available data) and Abstracts Views on Vision4Press platform.
Data correspond to usage on the plateform after 2015. The current usage metrics is available 48-96 hours after online publication and is updated daily on week days.
Initial download of the metrics may take a while.