Fig. 2.
Download original image
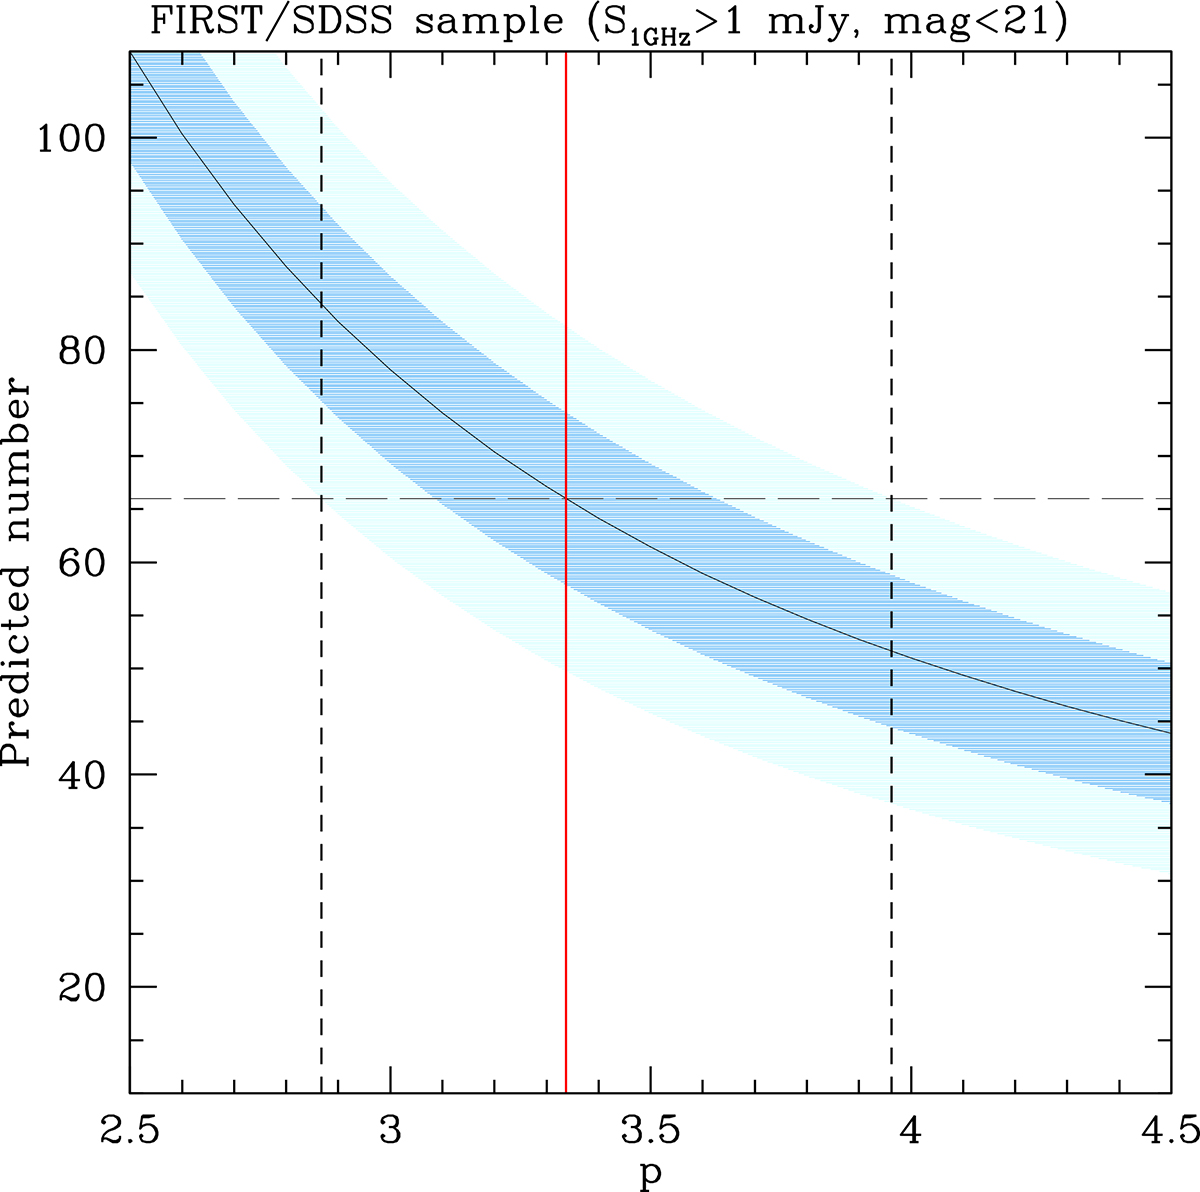
Predicted number of z ≥ 4 QSOs (both blazars and non-blazars) with the flux density at 1.4 GHz ≥1 mJy and magdrop ≤ 21 in the sky area covered by the FIRST sample based on the observed number of blazars in the same area. The predictions are shown as a function of the parameter ‘p’, while the shaded area shows the Poissonian uncertainty on this number (dark blue = 1σ, light blue = 2σ). The horizontal dashed line indicates the observed number of sources, while the vertical lines report the best value of p (red solid line) together with the 2σ confidence interval (black short-dashed lines).
Current usage metrics show cumulative count of Article Views (full-text article views including HTML views, PDF and ePub downloads, according to the available data) and Abstracts Views on Vision4Press platform.
Data correspond to usage on the plateform after 2015. The current usage metrics is available 48-96 hours after online publication and is updated daily on week days.
Initial download of the metrics may take a while.