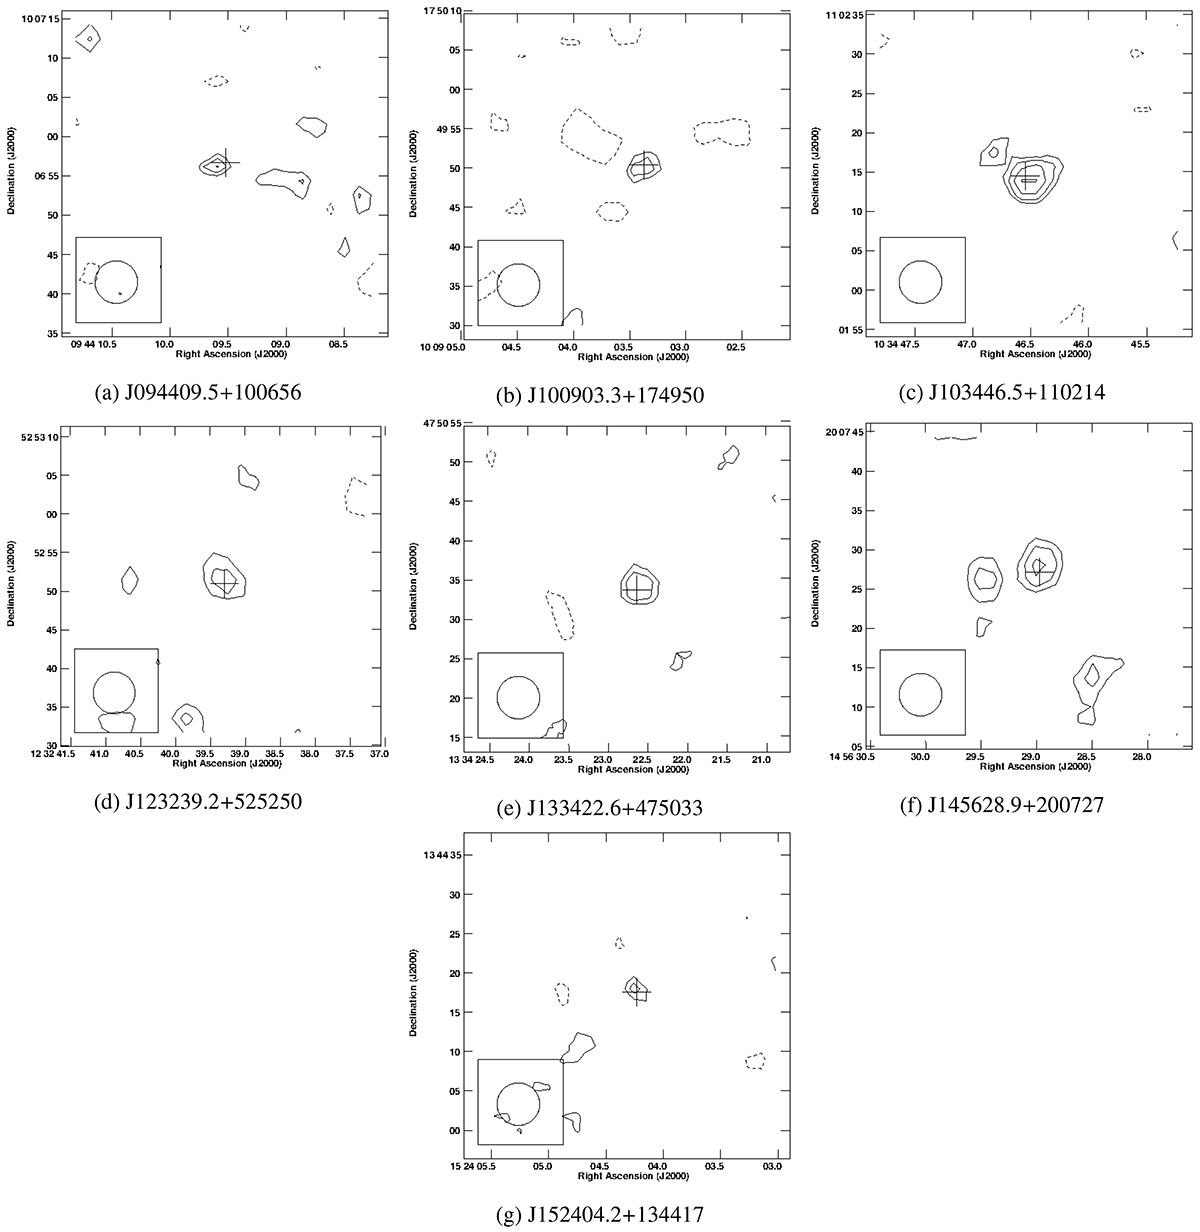
Fig. 1.
Download original image
Radio maps at 1.4 GHz from FIRST data of the seven high-z QSOs in the sample with peak flux densities between 0.5 and 0.9 mJy beam−1. These sources are not included in the FIRST catalogue. The levels were computed as −2, 2, 2.8, 4, 5.5, 8, ...times the rms (0.15 mJy beam−1). The central cross indicates the optical position of the high-z QSOs, while the beam size is reported in the bottom-left corner.
Current usage metrics show cumulative count of Article Views (full-text article views including HTML views, PDF and ePub downloads, according to the available data) and Abstracts Views on Vision4Press platform.
Data correspond to usage on the plateform after 2015. The current usage metrics is available 48-96 hours after online publication and is updated daily on week days.
Initial download of the metrics may take a while.