Open Access
Fig. 3.
Download original image
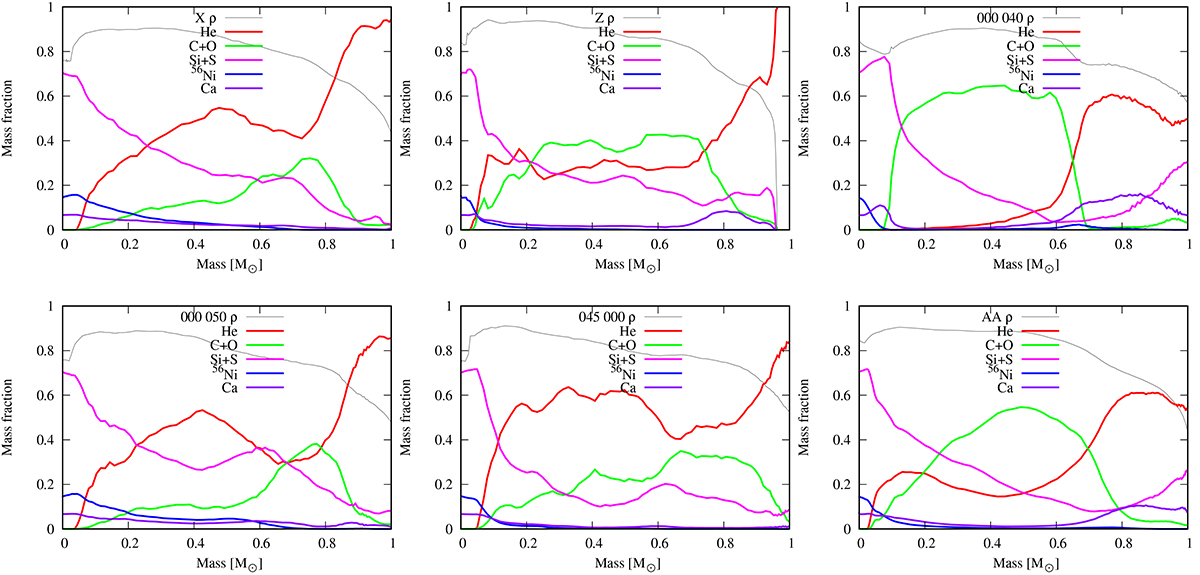
Chemical structure of the individual rays for the pure merger. The grey curves represent scaled density profiles (see details in the text). The labels ‘X’ and ‘Z’ stand for case x and case z in our set of selected directions.
Current usage metrics show cumulative count of Article Views (full-text article views including HTML views, PDF and ePub downloads, according to the available data) and Abstracts Views on Vision4Press platform.
Data correspond to usage on the plateform after 2015. The current usage metrics is available 48-96 hours after online publication and is updated daily on week days.
Initial download of the metrics may take a while.