Fig. 2.
Download original image
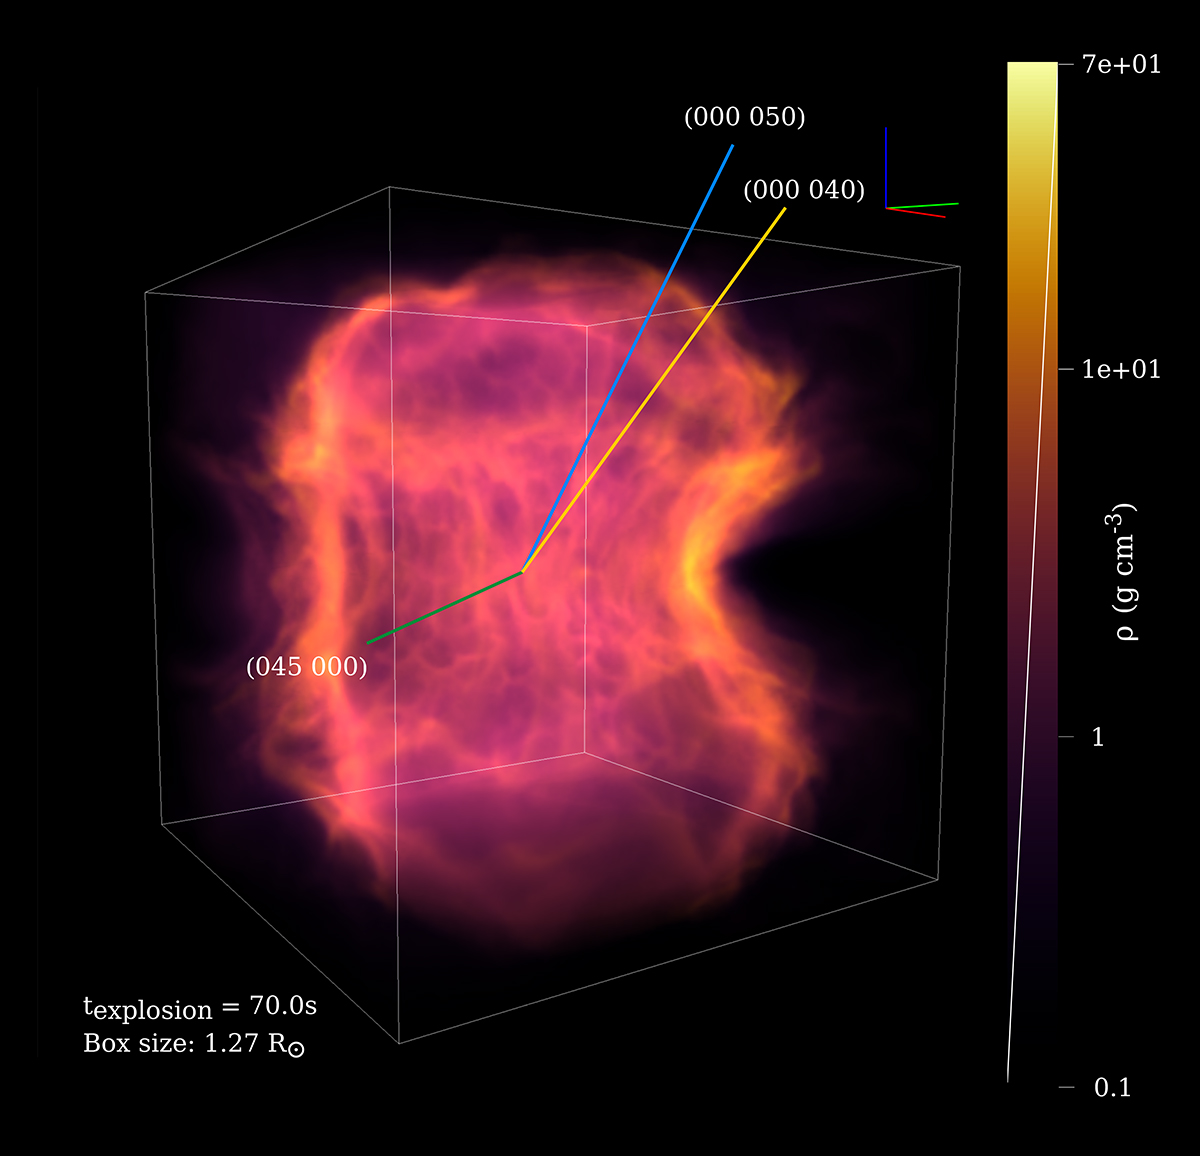
Volume rendering of the ejecta structure of the pure merger product without the surrounding envelope, colour-coded by density. The respective direction of the x-, y-, and z-axis is shown in a small diagram at the top of the rendering, next to the colour bar, as a red, green, and blue line. The coloured lines in the rendered volume illustrate three of the viewing angles used as input for the radiative-transfer simulations with STELLA performed in this work. The dark green line 045 000 is located in the x − y plane (orbital plane of the progenitor system), the light blue 000 050 and yellow 000 040 lines are both located in the x − z plane (perpendicular to the orbital plane of the progenitor system).
Current usage metrics show cumulative count of Article Views (full-text article views including HTML views, PDF and ePub downloads, according to the available data) and Abstracts Views on Vision4Press platform.
Data correspond to usage on the plateform after 2015. The current usage metrics is available 48-96 hours after online publication and is updated daily on week days.
Initial download of the metrics may take a while.