Fig. 8.
Download original image
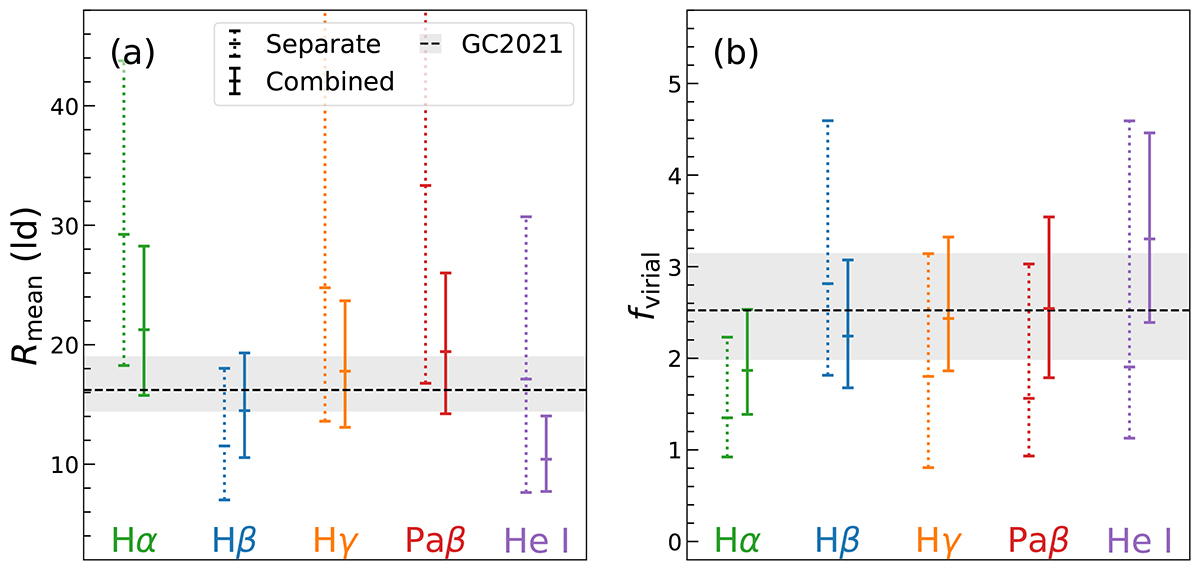
Comparison of derived parameters. Values of (a) mean radius and (b) virial factor are shown for the separate (dotted lines) and combined (solid lines) fits. The three horizontal bars on each line correspond to the 16th, 50th, and 84th percentiles of the posterior distribution. The dashed lines and gray regions represent the results from the SARM joint analysis (GRAVITY Collaboration 2021b).
Current usage metrics show cumulative count of Article Views (full-text article views including HTML views, PDF and ePub downloads, according to the available data) and Abstracts Views on Vision4Press platform.
Data correspond to usage on the plateform after 2015. The current usage metrics is available 48-96 hours after online publication and is updated daily on week days.
Initial download of the metrics may take a while.