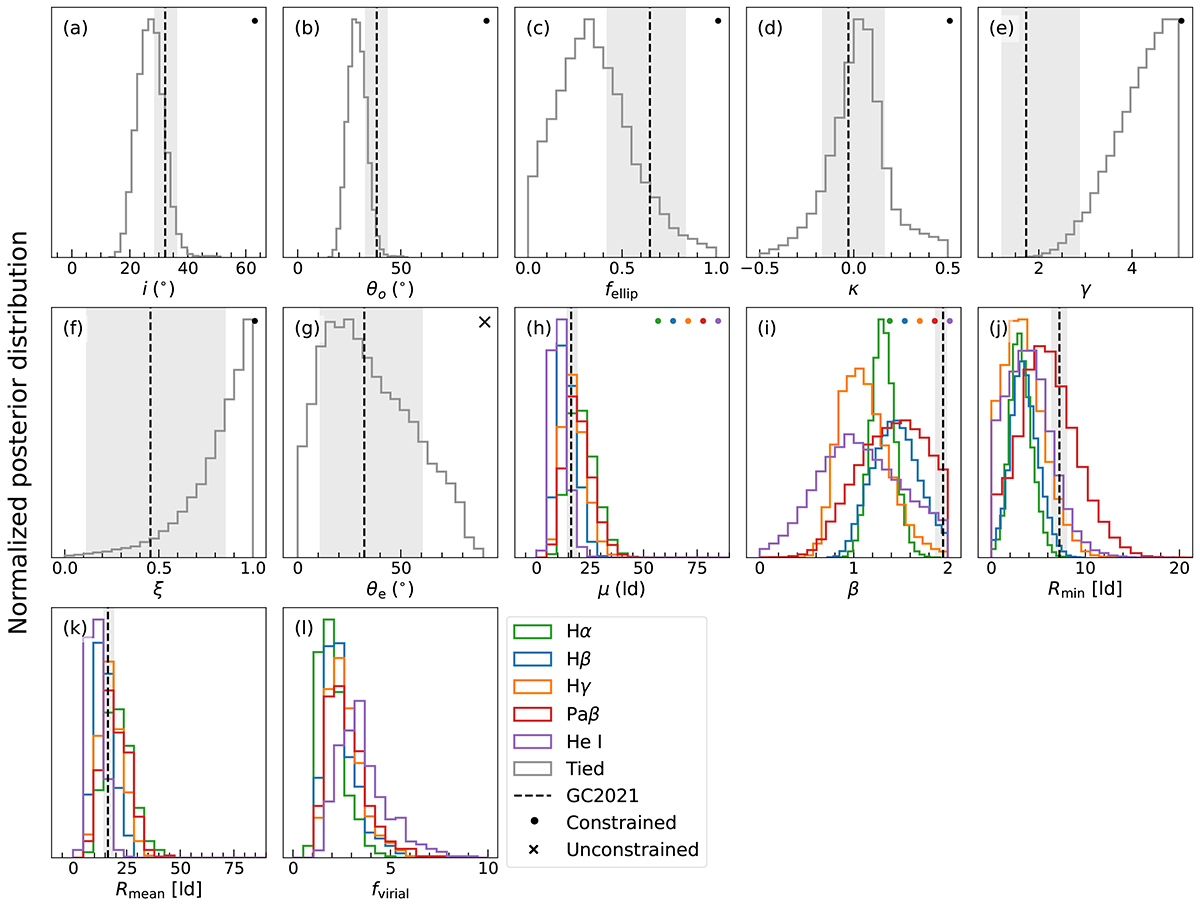
Fig. 7.
Download original image
Posterior probability distribution of the five lines fitted simultaneously with tied geometry parameters. The panels and symbols are similar to those of Fig. 5. For comparison, as before, the dashed vertical line and the shaded region indicate the model inference results from the joint SARM fit (GRAVITY Collaboration 2021b).
Current usage metrics show cumulative count of Article Views (full-text article views including HTML views, PDF and ePub downloads, according to the available data) and Abstracts Views on Vision4Press platform.
Data correspond to usage on the plateform after 2015. The current usage metrics is available 48-96 hours after online publication and is updated daily on week days.
Initial download of the metrics may take a while.