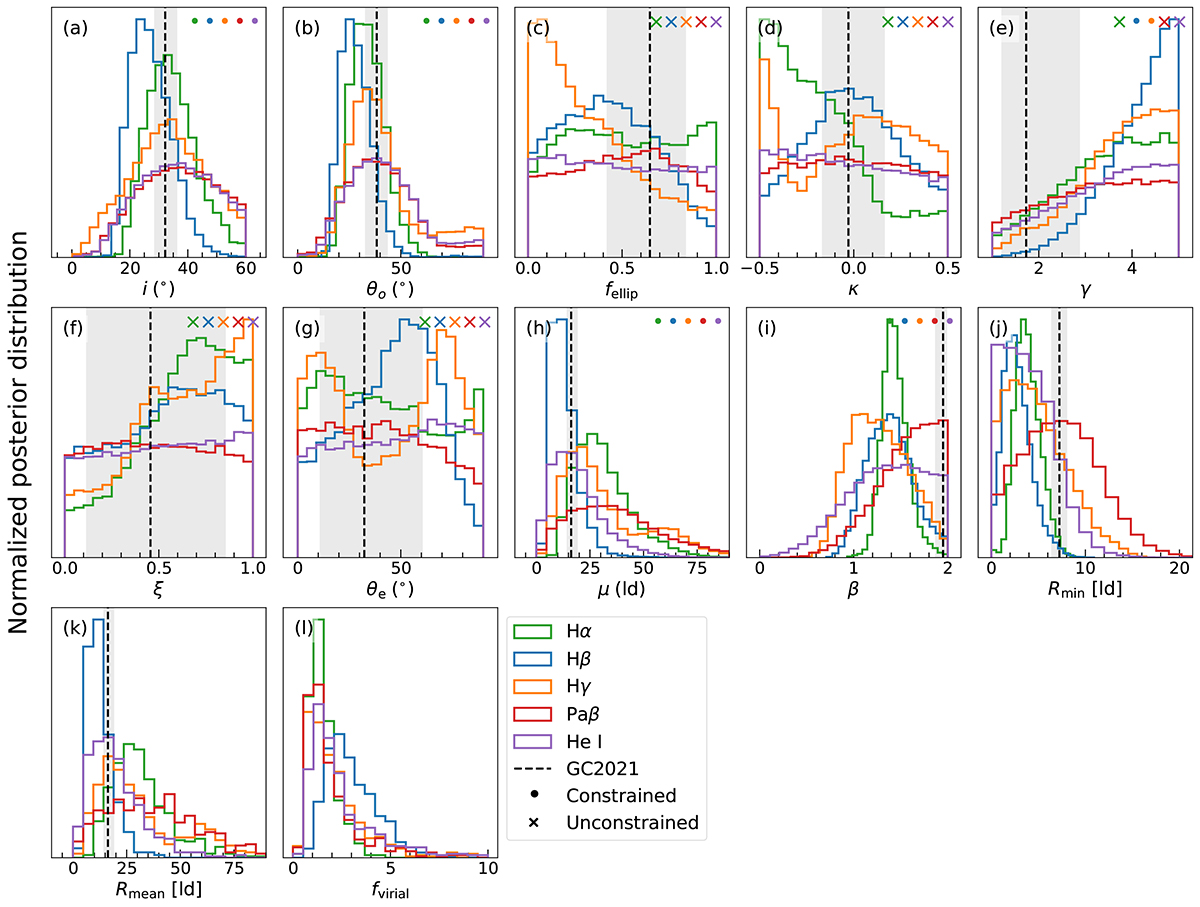
Fig. 5.
Download original image
Posterior probability distributions of the five lines fitted separately shown in colored histograms. For comparison, the dashed vertical line and the shaded region indicate the model inference best-fit results and 1-σ intervals from the SARM joint analysis (GRAVITY Collaboration 2021b). Panels a–i present the physical model parameters that are directly sampled in the fitting. The circles and crosses in these panels indicate whether these parameters are constrained by the data for each line profile (by comparing the width of their posterior distributions with their prior range). The remaining panels present parameters that are derived from the posterior samples. The y-axis tick labels are unimportant, so we removed them for clarity. Details are discussed in Sect. 4.2.
Current usage metrics show cumulative count of Article Views (full-text article views including HTML views, PDF and ePub downloads, according to the available data) and Abstracts Views on Vision4Press platform.
Data correspond to usage on the plateform after 2015. The current usage metrics is available 48-96 hours after online publication and is updated daily on week days.
Initial download of the metrics may take a while.