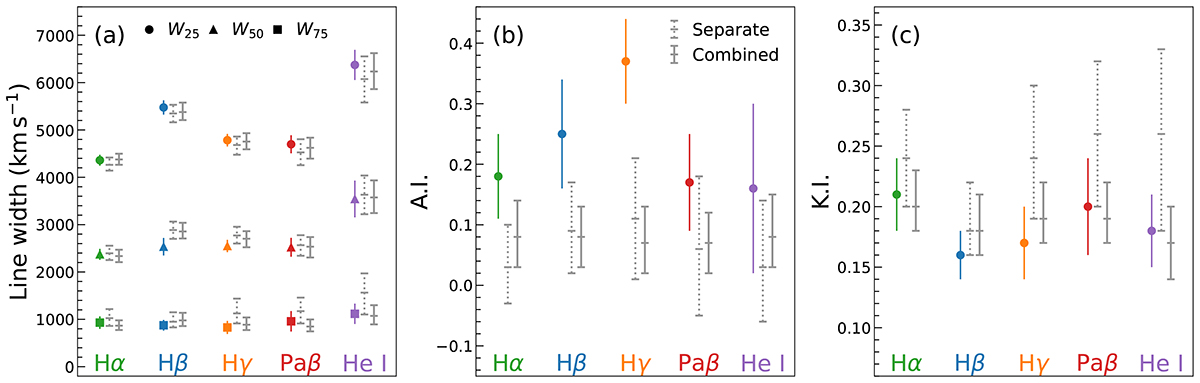
Fig. 3.
Download original image
Comparison of the nonparametric properties of the line profiles (denoted by different colors and with 1σ uncertainties). Panel a: line widths (circles, triangles, and squares represent W25, W50, and W75, respectively). Panel b: asymmetry index (A.I.). Panel c: kurtosis index (K.I.). In the panels, the gray lines correspond to equivalent measurements on the model line profiles for the separate (dotted) and combined (solid) fitting results.
Current usage metrics show cumulative count of Article Views (full-text article views including HTML views, PDF and ePub downloads, according to the available data) and Abstracts Views on Vision4Press platform.
Data correspond to usage on the plateform after 2015. The current usage metrics is available 48-96 hours after online publication and is updated daily on week days.
Initial download of the metrics may take a while.