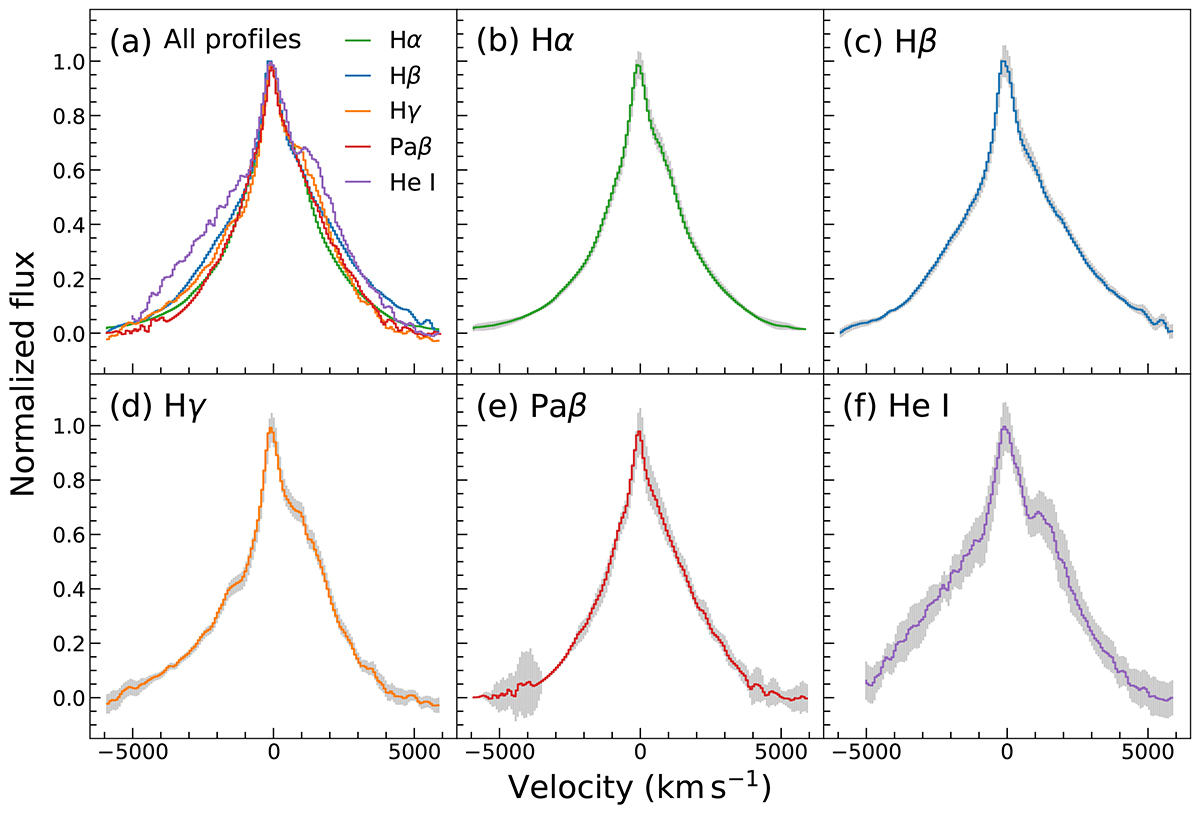
Fig. 2.
Download original image
Normalized broad emission line profiles of Hα, Hβ, Hγ, Paβ, and He I. These were extracted as described in Sect. 2.2. Panel a shows the profiles superimposed for an easier comparison, while panels b–f display the line profiles individually. The uncertainties are shown in gray. The masked data have been replaced by the multi-Gaussian model, as shown in Fig. 1 for clarity.
Current usage metrics show cumulative count of Article Views (full-text article views including HTML views, PDF and ePub downloads, according to the available data) and Abstracts Views on Vision4Press platform.
Data correspond to usage on the plateform after 2015. The current usage metrics is available 48-96 hours after online publication and is updated daily on week days.
Initial download of the metrics may take a while.