Fig. 1.
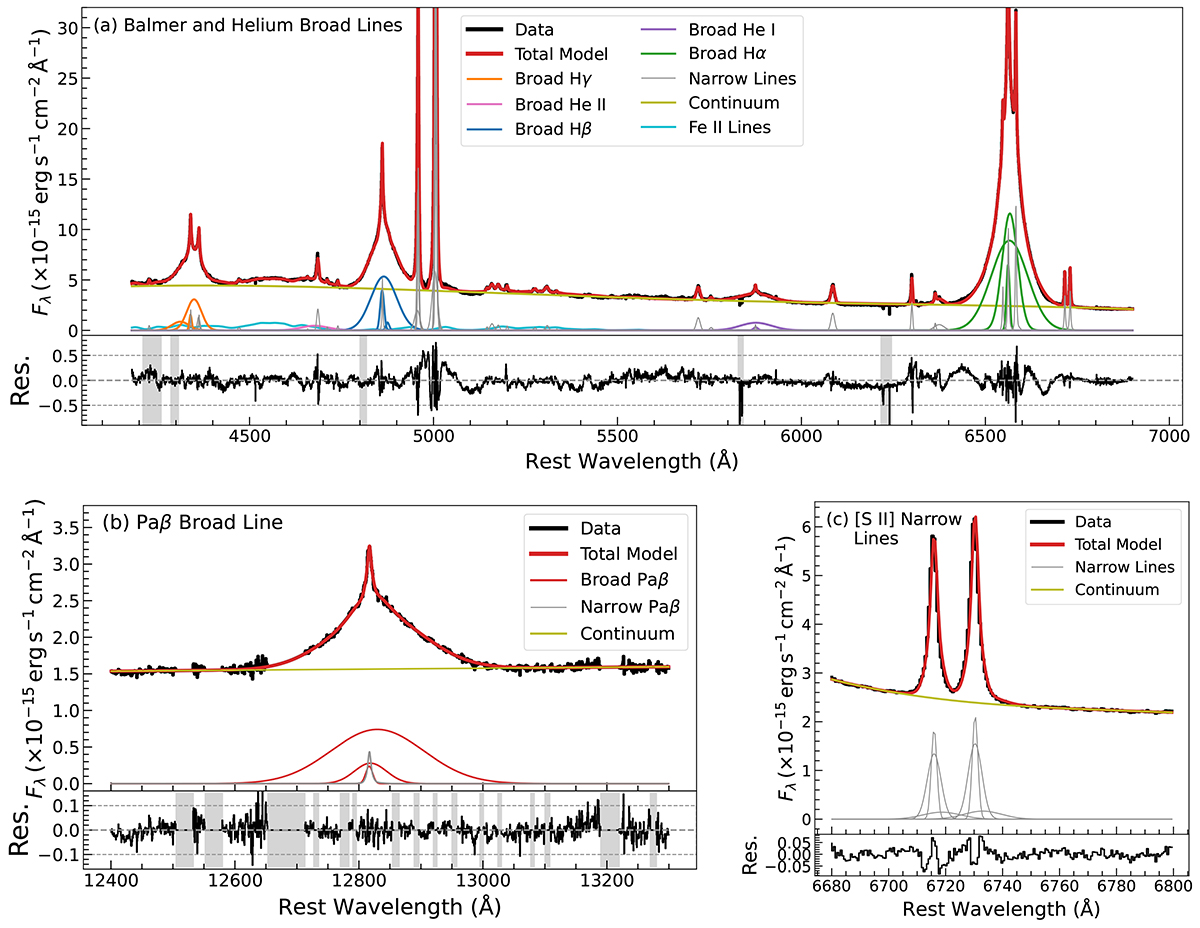
Download original image
X-shooter spectrum of NGC 3783 simultaneously covering UV, optical, and NIR ranges. In each panel, the spectrum is shown with the full model that enables decomposition of the broad-line profiles overplotted, and the residual is shown underneath. The emission line components are also plotted separately. The gray-shaded regions in the residuals represent wavelength ranges of bad channels and features due to the poor telluric correction, which are masked in the fitting. Panel a: UV/optical spectrum with the Hα, Hβ, and Hγ lines. Panel b: part of the NIR spectrum used in this study, with the Paβ line. Panel c: [S II] doublet used as the narrow line template.
Current usage metrics show cumulative count of Article Views (full-text article views including HTML views, PDF and ePub downloads, according to the available data) and Abstracts Views on Vision4Press platform.
Data correspond to usage on the plateform after 2015. The current usage metrics is available 48-96 hours after online publication and is updated daily on week days.
Initial download of the metrics may take a while.