Fig. 7.

Download original image
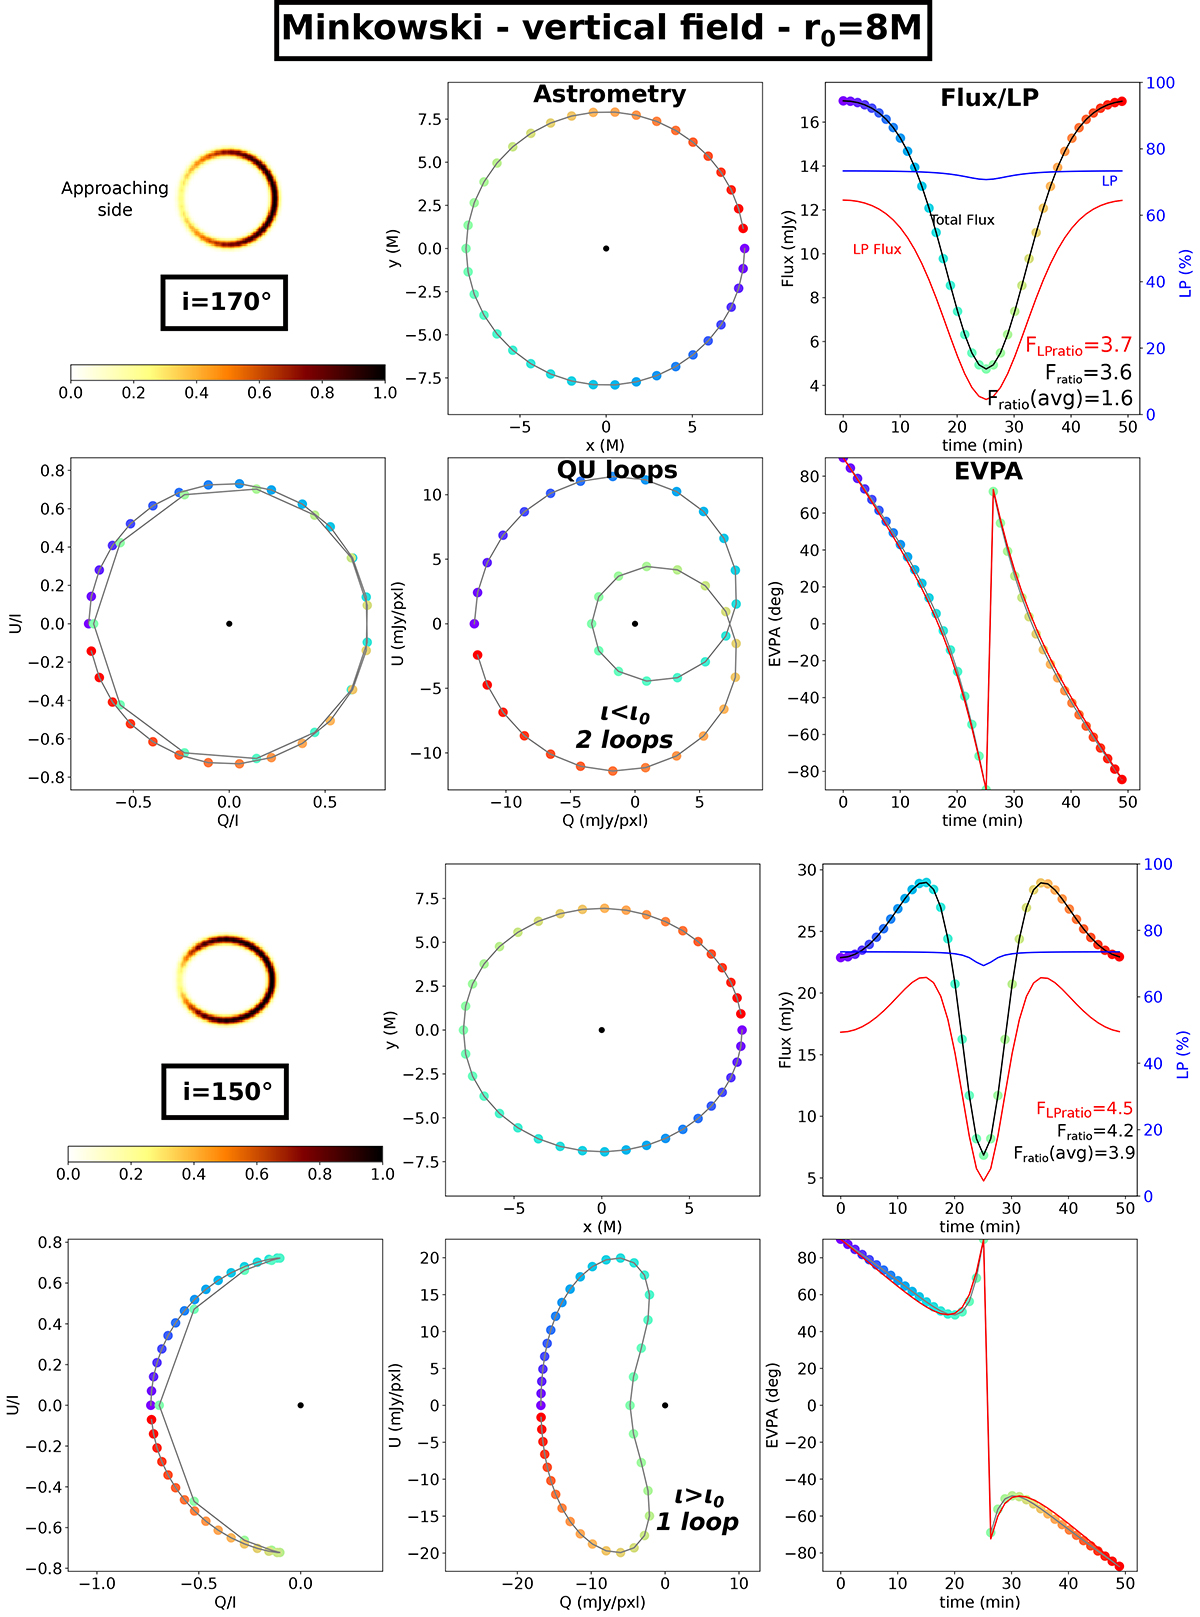
Minkowski QU loops in the vertical magnetic field. The top six panels were computed for ι = 10 ° < ι0, where ι0 is defined in Eq. (39) and defines the highest angle for which there should be two QU loops. The bottom six panels were computed for ι = 10 ° > ι0. The six panels represent the following quantities. Top-left: summed images of the hot spot in normalized intensity. We note that the color coding has been inverted to improve readability (i.e., a darker color means more intense emission). Top-middle: astrometric track on sky. In this panel and the next ones, the color codes (from violet to red) are for time, clockwise motion on sky. Top-right: total flux (colored dots), linearly polarized flux (![]() , red curve), and linear polarization fraction (LP, in percent, blue curve) evolution. The flux ratio Fratio (maximum over minimum fluxes) is provided in the bottom-right corner of the panel together with the linearly polarized flux ratio (written in red) and the flux ratio Fratio(avg) obtained after averaging over the angular dependence of the radiative transfer coefficients (the sin θB dependence). We note that the density and temperature of the hot spot have been chosen such that the low-inclination, vertical magnetic field near infrared flux peaks at around 10 mJy. Bottom-left: Q/I, U/I plane. Bottom-middle: Q, U plane (which we refer to when discussing the QU loops). Bottom-right: observed EVPA evolution. The red profile shows the emission EVPA evolution as predicted by the analytic model derived in Eq. (30). As predicted, the upper case shows two QU loops, while the bottom one shows only one loop.
, red curve), and linear polarization fraction (LP, in percent, blue curve) evolution. The flux ratio Fratio (maximum over minimum fluxes) is provided in the bottom-right corner of the panel together with the linearly polarized flux ratio (written in red) and the flux ratio Fratio(avg) obtained after averaging over the angular dependence of the radiative transfer coefficients (the sin θB dependence). We note that the density and temperature of the hot spot have been chosen such that the low-inclination, vertical magnetic field near infrared flux peaks at around 10 mJy. Bottom-left: Q/I, U/I plane. Bottom-middle: Q, U plane (which we refer to when discussing the QU loops). Bottom-right: observed EVPA evolution. The red profile shows the emission EVPA evolution as predicted by the analytic model derived in Eq. (30). As predicted, the upper case shows two QU loops, while the bottom one shows only one loop.
Current usage metrics show cumulative count of Article Views (full-text article views including HTML views, PDF and ePub downloads, according to the available data) and Abstracts Views on Vision4Press platform.
Data correspond to usage on the plateform after 2015. The current usage metrics is available 48-96 hours after online publication and is updated daily on week days.
Initial download of the metrics may take a while.


