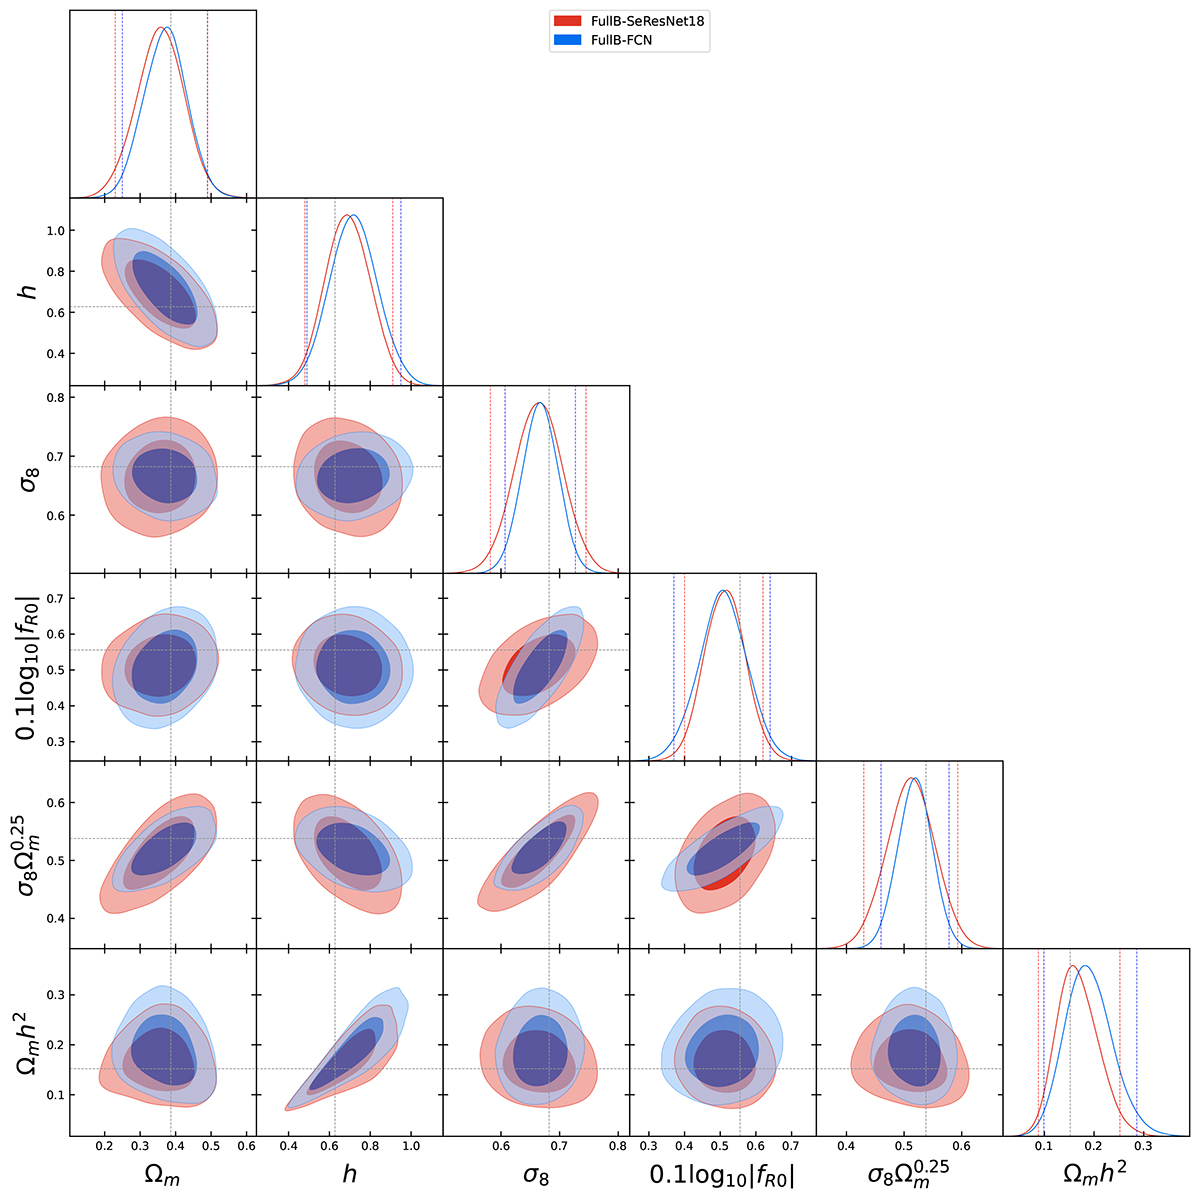
Fig. 7.
Download original image
68% and 95% parameter constraint contours from one example of the test dataset using FullB-SeResNet and Full-FCN. The diagonal plots are the marginalised parameter constraints, and the dashed black lines stand for the true values reported in Table 6. The vertical dashed red and blue lines represent the 1σ for the marginals using FullB-SeResNet and Full-FCN, respectively. We derived these posterior distributions using GetDist (Lewis 2019).
Current usage metrics show cumulative count of Article Views (full-text article views including HTML views, PDF and ePub downloads, according to the available data) and Abstracts Views on Vision4Press platform.
Data correspond to usage on the plateform after 2015. The current usage metrics is available 48-96 hours after online publication and is updated daily on week days.
Initial download of the metrics may take a while.