Open Access
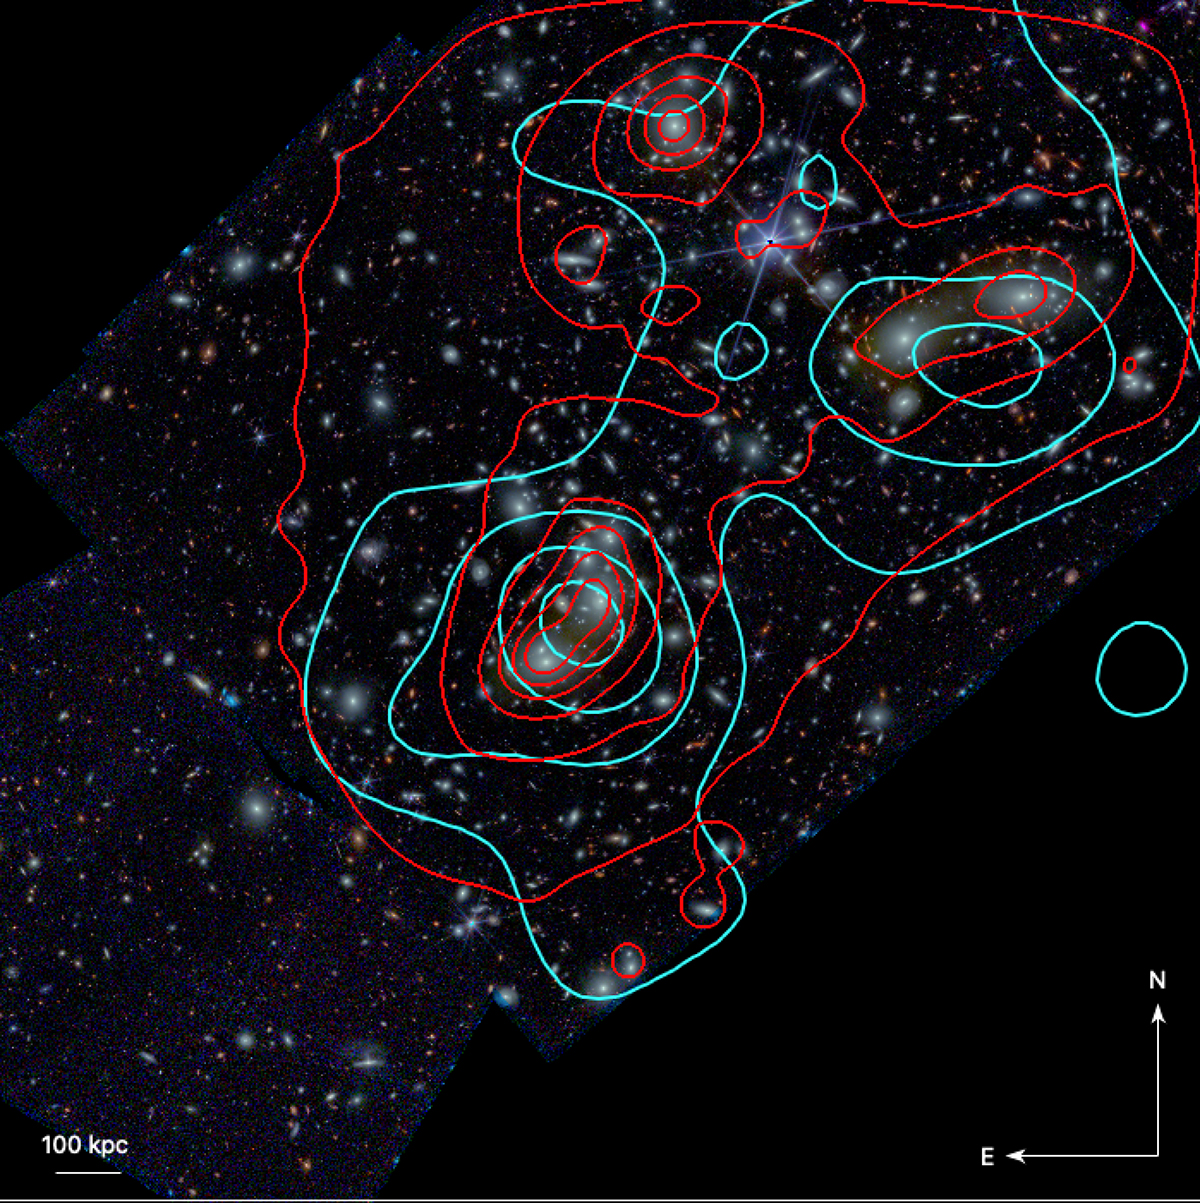
Fig. 9.
Download original image
Central 900 kpc × 900 kpc region of the composite JWST rgb image with overlaid the contour levels of the surface mass distribution emerging from the SL (Bergamini et al. 2023b, in red) and our WL (in cyan) studies. The contour levels depicted are linearly spaced between 0.5 × 10¹⁵ M⊙/Mpc2 and 2.4 × 10¹⁵ M⊙/Mpc2.
Current usage metrics show cumulative count of Article Views (full-text article views including HTML views, PDF and ePub downloads, according to the available data) and Abstracts Views on Vision4Press platform.
Data correspond to usage on the plateform after 2015. The current usage metrics is available 48-96 hours after online publication and is updated daily on week days.
Initial download of the metrics may take a while.