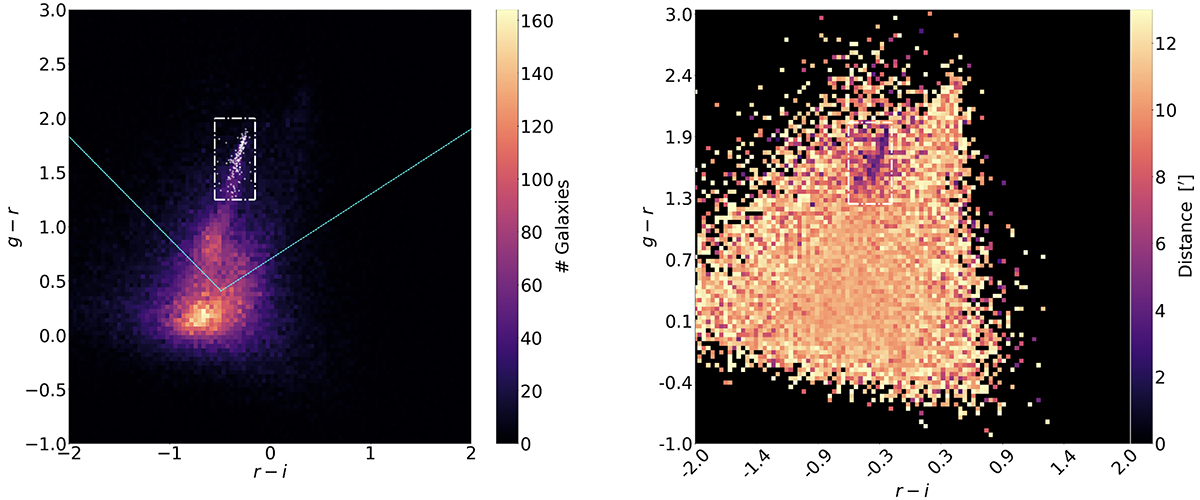
Fig. 3.
Download original image
Distribution of the identified galaxies in a colour–colour diagram. The left panel is the colour–colour (CC) diagram g − r vs. r − i, whereas the right panel displays the distribution of the mean distances of the galaxies from the centre of the image in the same space. The rectangular box identified with the white lines in both panels identifies the region where the cluster was estimated to lie in the CC space. In the left panel the white dots identify the 201 spectroscopically confirmed cluster members. The cyan lines in the left panel denote the region below which the background galaxies are assumed to lie.
Current usage metrics show cumulative count of Article Views (full-text article views including HTML views, PDF and ePub downloads, according to the available data) and Abstracts Views on Vision4Press platform.
Data correspond to usage on the plateform after 2015. The current usage metrics is available 48-96 hours after online publication and is updated daily on week days.
Initial download of the metrics may take a while.