Open Access
Fig. 2.
Download original image
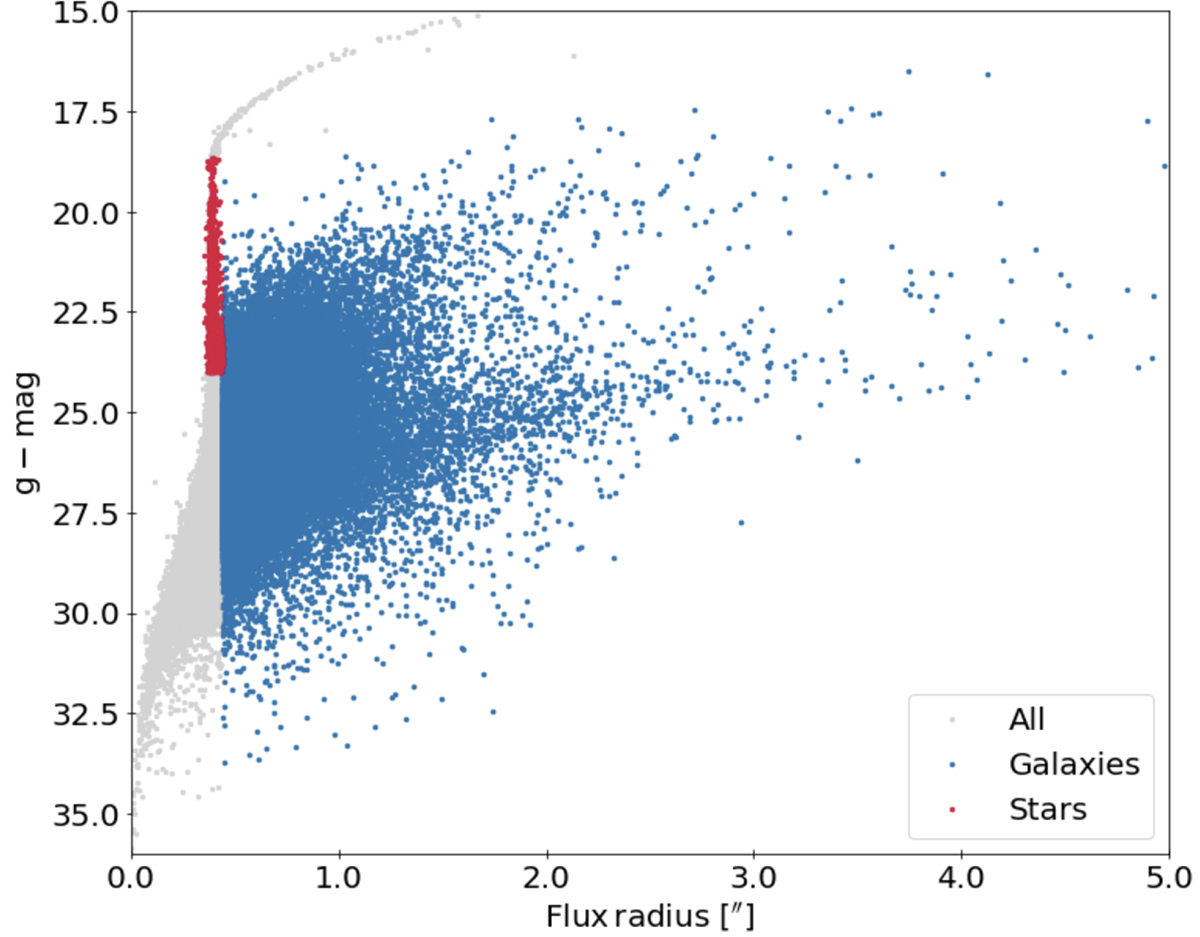
Classification of the sources between galaxies (blue) and stars (red) after the comparison of the three bands from the Magellan data, as illustrated in the text, in a magnitude–size diagram. Also shown are all the detected sources (in grey). The values of the magnitude and flux radius reported here refer to the g band.
Current usage metrics show cumulative count of Article Views (full-text article views including HTML views, PDF and ePub downloads, according to the available data) and Abstracts Views on Vision4Press platform.
Data correspond to usage on the plateform after 2015. The current usage metrics is available 48-96 hours after online publication and is updated daily on week days.
Initial download of the metrics may take a while.