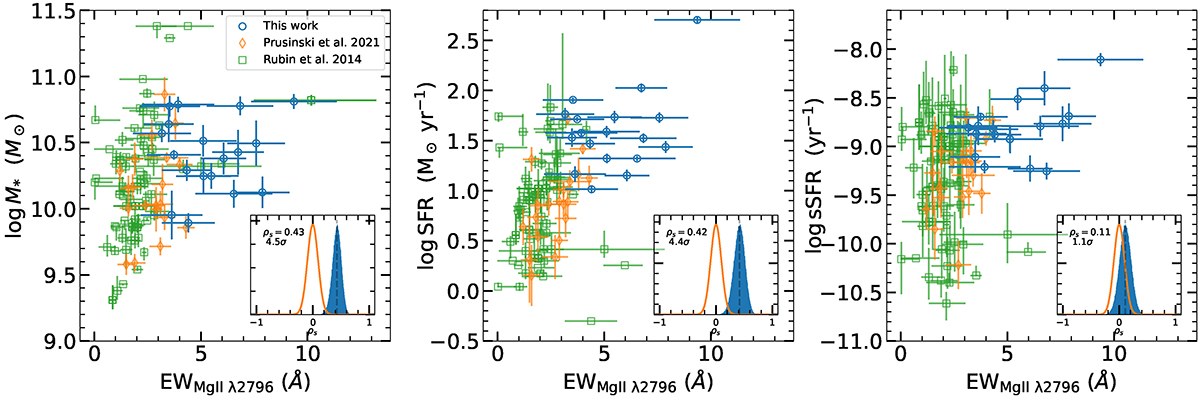
Fig. 5.
Download original image
Plot of the Mg IIλ2796 EW versus M*, SFR, and sSFR (from left to right). The empty blue circles are the results obtained here, the empty orange diamonds are the results of PR21 and the green empty squares are the results of RU14. The inset graph in each panel contains the probability distribution of the Spearman parameter from the bootstrap procedure in blue (see the text for more details) and the expected distribution in the uncorrelated case is shown in orange. The value of the mode of the obtained distribution and the significance in sigmas for the obtained correlation are also included. See the Sect. 4.1 for a discussion of correlation.
Current usage metrics show cumulative count of Article Views (full-text article views including HTML views, PDF and ePub downloads, according to the available data) and Abstracts Views on Vision4Press platform.
Data correspond to usage on the plateform after 2015. The current usage metrics is available 48-96 hours after online publication and is updated daily on week days.
Initial download of the metrics may take a while.