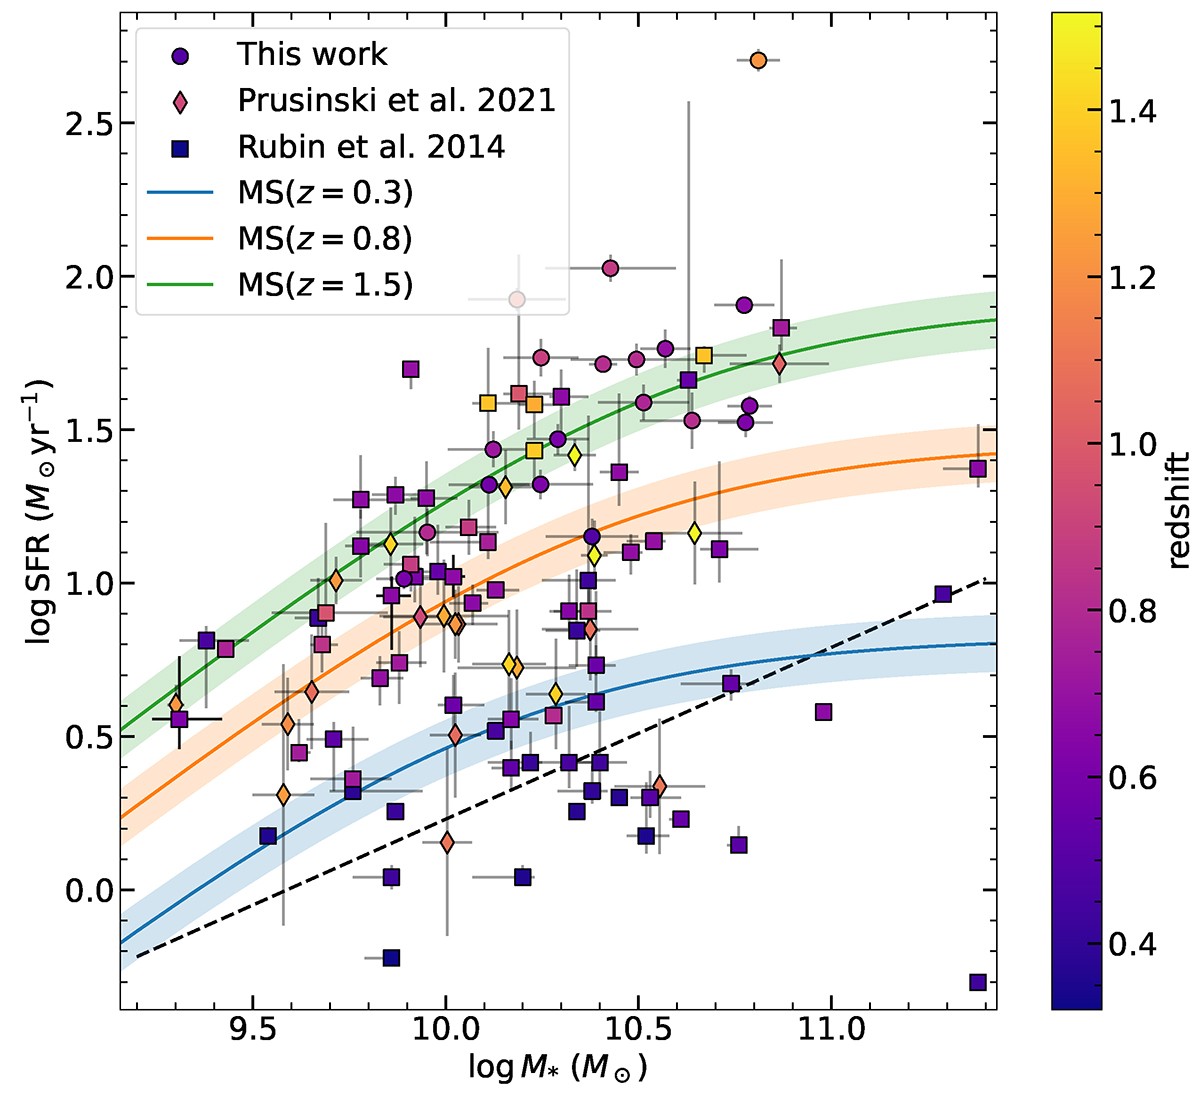
Fig. 3.
Download original image
Diagram of M* versus SFR of the sample studied, colour coded according to the spectroscopic redshift. The data from Lockman–SpReSO are represented by circles, PR21 data are represented by diamonds, and RU14 data are represented by squares. The dotted line represents the Murray et al. (2011) limit for producing winds in galaxies. The blue, red, and green solid lines and shaded areas are the Popesso et al. (2023) fit for the main sequence and its scatter of 0.09 dex calculated at the minimum, median, and maximum redshift of the sample, respectively.
Current usage metrics show cumulative count of Article Views (full-text article views including HTML views, PDF and ePub downloads, according to the available data) and Abstracts Views on Vision4Press platform.
Data correspond to usage on the plateform after 2015. The current usage metrics is available 48-96 hours after online publication and is updated daily on week days.
Initial download of the metrics may take a while.