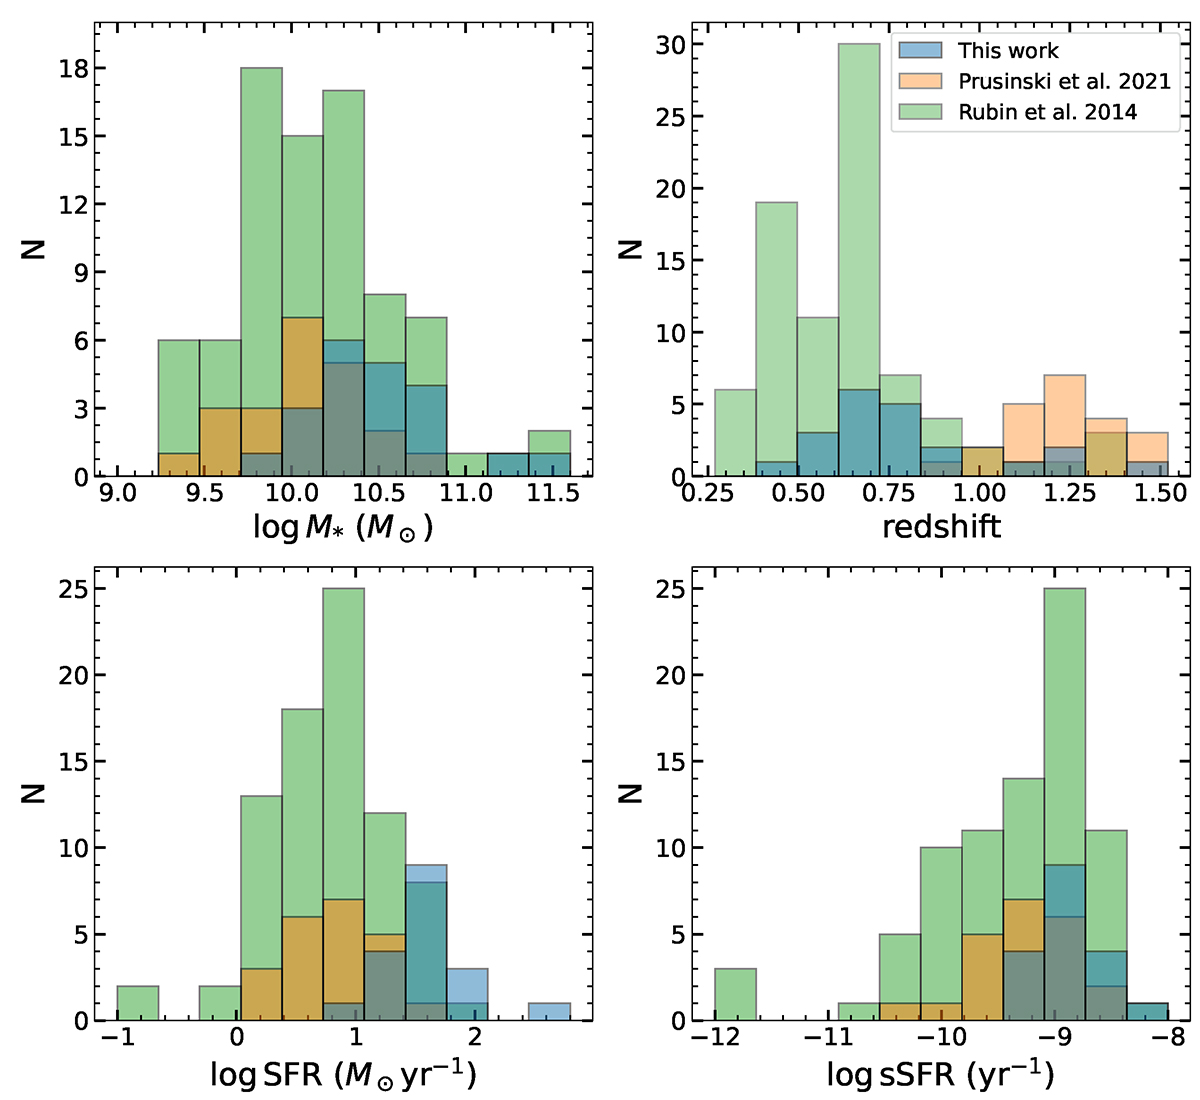
Fig. 2.
Download original image
Main properties of the studied objects. The blue bars represent the objects from Lockman–SpReSO survey, the orange bars represent the objects from PR21 and the green bars are the objects from RU14. The top left panel shows the M* of the objects, the top right shows the spectroscopic redshift, the bottom left shows the SFR and, the bottom right shows the sSFR.
Current usage metrics show cumulative count of Article Views (full-text article views including HTML views, PDF and ePub downloads, according to the available data) and Abstracts Views on Vision4Press platform.
Data correspond to usage on the plateform after 2015. The current usage metrics is available 48-96 hours after online publication and is updated daily on week days.
Initial download of the metrics may take a while.