Fig. A.1.
Download original image
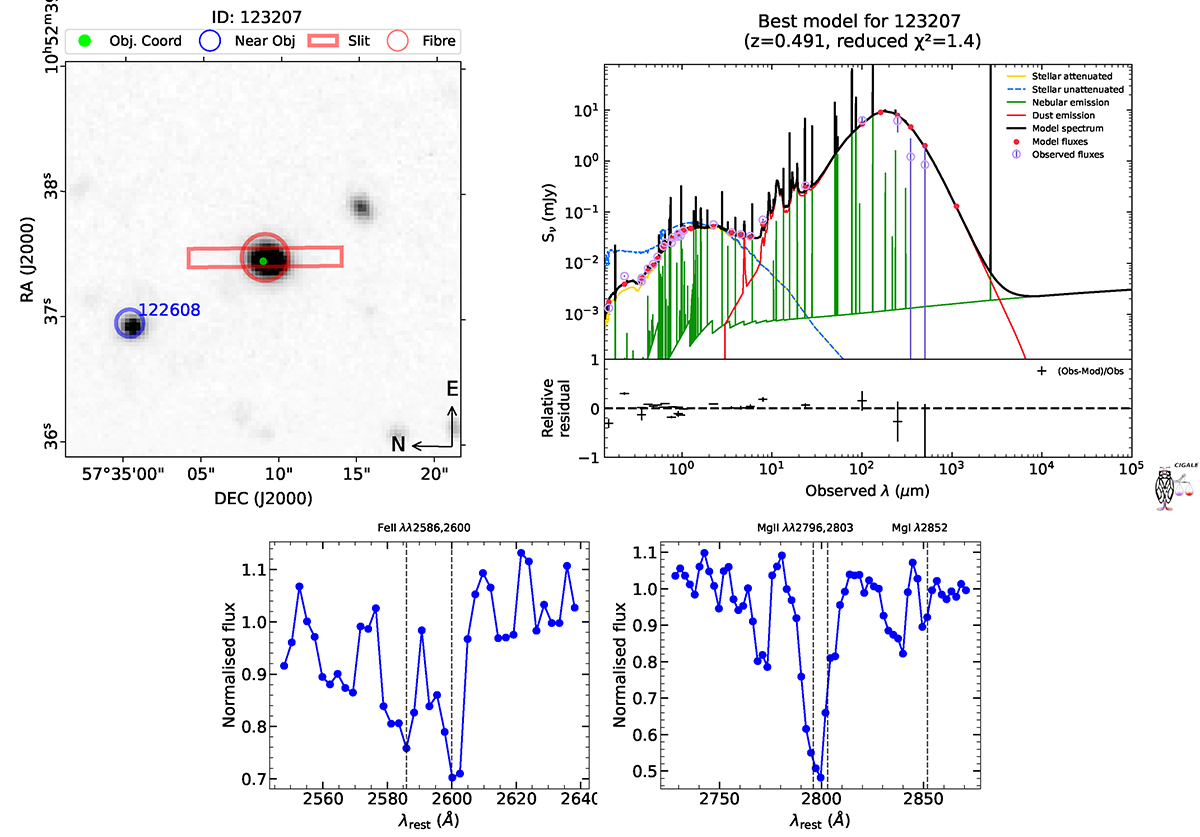
Cutouts (top left), SED fits (top right), and spectra slices (bottom) for the object ID 123207 studied in this paper. The cutouts are made on the GTC image of the Lockman-SpReSO survey field (see Gonzalez-Otero et al. 2023 for details). The green dot represents the optical coordinates of the object. The blue circle marks nearby objects in the Lockman-SpReSO catalogue. The red rectangle represents the position and size of the slit used to observe the object. There are two types of slit: a small slit of 3 arcsec and a large slit of 10 arcsec (see Gonzalez-Otero et al. 2023 for more details). The red circle represents the position of the fibre. In the SED fits the best model is plotted as a solid black line, the photometric information of the object is plotted as empty violet circles, and the red filled circles are the fluxes obtained by the best model. The individual contributions of the models used are also plotted where the yellow line represents the attenuated stellar component, the blue dashed line is the unattenuated stellar component, the green line illustrates the nebular emission, and the red line is the dust emission. The relative residuals of the flux for the best model are plotted at the bottom. The spectral slices show the absorption lines studied in this paper. The spectra have been normalised to the continuum. The grey vertical dashed lines represent the rest-frame wavelength of the lines.
Current usage metrics show cumulative count of Article Views (full-text article views including HTML views, PDF and ePub downloads, according to the available data) and Abstracts Views on Vision4Press platform.
Data correspond to usage on the plateform after 2015. The current usage metrics is available 48-96 hours after online publication and is updated daily on week days.
Initial download of the metrics may take a while.