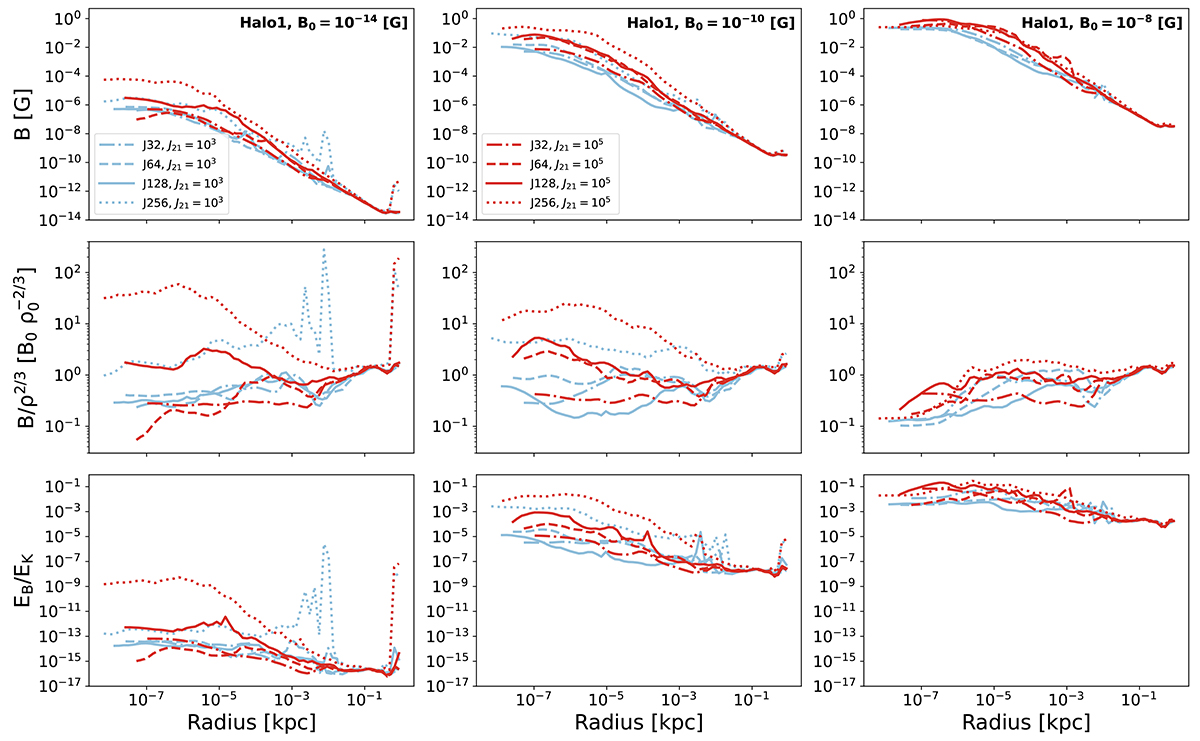
Fig. 4.
Download original image
Mass-weighted spherically binned radial profiles of magnetic field strength, magnetic field amplification B/ρ2/3, and the magnetic-to-kinetic energy density ratio EB/EK for halo 1 when reaching a peak density of 3 × 10⁻¹³ g cm−3. The first, second, and third column of this multiple plot shows the magnetic properties of the runs with a proper initial magnetic field strength of B0 = 10−14 [G], B0 = 10−10 [G], and B0 = 10−8 [G], respectively. The light blue lines represent the simulations with J21 = 103 where the cooling is driven via molecular hydrogen, and the red lines are for simulations with J21 = 105 where the cooling is driven by atomic hydrogen. The different line styles represent different Jeans resolutions: dash-dotted for 32 cells, dashed for 64 cells, solid for 128 cells, and dotted for 256 cells per Jeans length. Independently of the value of J21, the magnetic field strength, as well as the other magnetic properties, increases with increasing Jeans resolution for the runs with B0 = 10−14 [G]. When increasing the initial magnetic field the simulations with J21 = 103 start to present a dependency loss on the Jeans resolution at lower B0 in comparison with the atomic cooling runs, which suggest that potentially the saturation occurs first in these simulations.
Current usage metrics show cumulative count of Article Views (full-text article views including HTML views, PDF and ePub downloads, according to the available data) and Abstracts Views on Vision4Press platform.
Data correspond to usage on the plateform after 2015. The current usage metrics is available 48-96 hours after online publication and is updated daily on week days.
Initial download of the metrics may take a while.