Fig. 6
Download original image
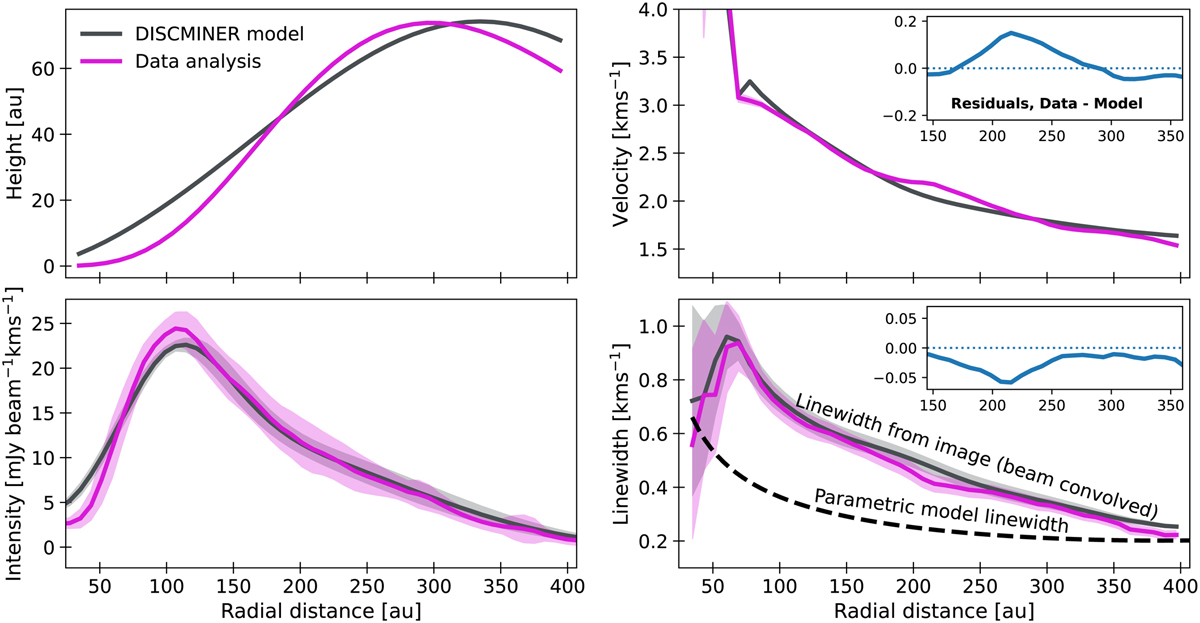
Comparison between various radial profiles between the data (magenta curves) and the DISCMINER model (gray curves). All panels except the height profile indicate the profile dispersion as a shaded region. Velocity and linewidth panels have a noticeable difference located at ~220 au, a blue residual curve characterizes this feature in the upper right corner of each panel. The linewidth panel shows the measured linewidth extracted from the data and the beam-convolved model by fitting the spectra. Additionally, the dashed black line indicates the intrinsic parametric form of the linewidth, as fitted by DISCMINER. The beam-convolved model will always have a broader linewidth than the parametric form and is used to directly compare our model to the data, which has a finite sptial resolution. However, the intrinsic linewidth is what we used in our calculations, as this is expected to be the actual line broadening due to thermal and nonthermal motions.
Current usage metrics show cumulative count of Article Views (full-text article views including HTML views, PDF and ePub downloads, according to the available data) and Abstracts Views on Vision4Press platform.
Data correspond to usage on the plateform after 2015. The current usage metrics is available 48-96 hours after online publication and is updated daily on week days.
Initial download of the metrics may take a while.