Fig. 5
Download original image
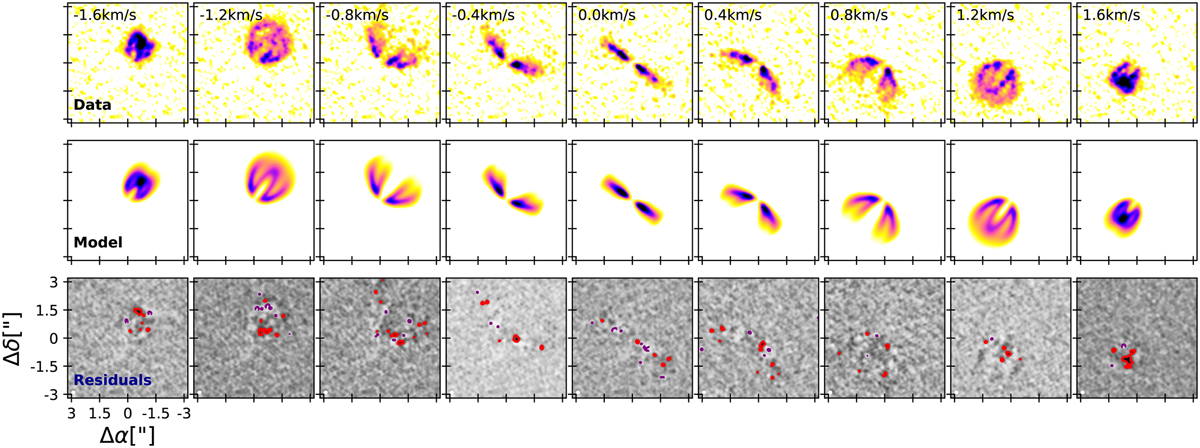
DISCMINER results and comparison to CN data. First row: selection of channel maps from the CN datacube. Velocities are relative to the systemic velocity, and the spectral resolution of each channel is 0.1 km s–1. Middle row: channel maps from the best-fit DISCMINER model, at the same spatial resolution and intensity scale as the observations. Bottom row: residual (observations minus model) emission. Contours indicate 5σ positive (red) and negative (purple) residuals, where σ is the data rms (1 mJy beam–1).
Current usage metrics show cumulative count of Article Views (full-text article views including HTML views, PDF and ePub downloads, according to the available data) and Abstracts Views on Vision4Press platform.
Data correspond to usage on the plateform after 2015. The current usage metrics is available 48-96 hours after online publication and is updated daily on week days.
Initial download of the metrics may take a while.