Fig. 3
Download original image
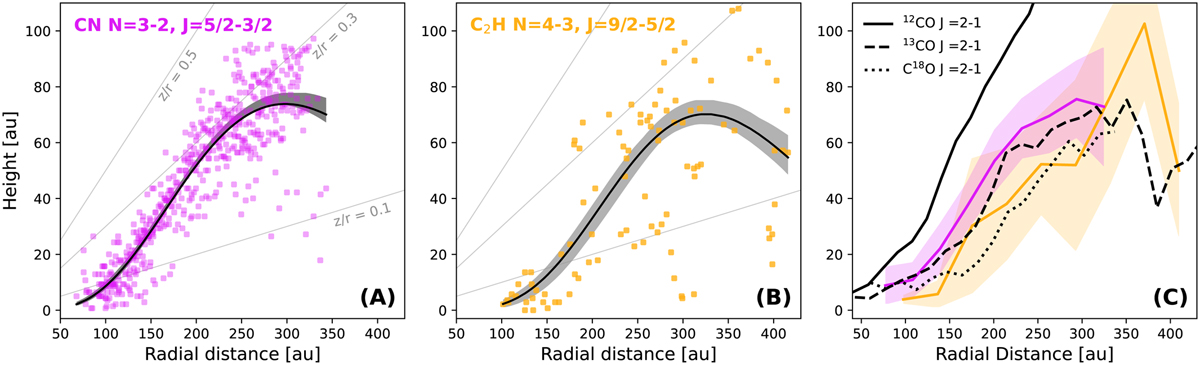
Vertical profiles of each tracer. Panels A and B show the data and best fit model for CN and C2H, respectively (the molecule and hyperfine group used is shown in the upper left corner). Each colored dot represents the vertical location extracted at a given radius from the maxima of emission traced in the channel maps. Overlaid is an exponentially tapered model with the best-fit parameters and the statistical uncertainty of the profile. Panel C presents a comparison between the averaged values and standard deviation within radial bins for CN and C2H (in colors) compared to the averaged CO isotopolog emission surfaces as presented in Paneque-Carrefio et al. (2023).
Current usage metrics show cumulative count of Article Views (full-text article views including HTML views, PDF and ePub downloads, according to the available data) and Abstracts Views on Vision4Press platform.
Data correspond to usage on the plateform after 2015. The current usage metrics is available 48-96 hours after online publication and is updated daily on week days.
Initial download of the metrics may take a while.