Fig. 2
Download original image
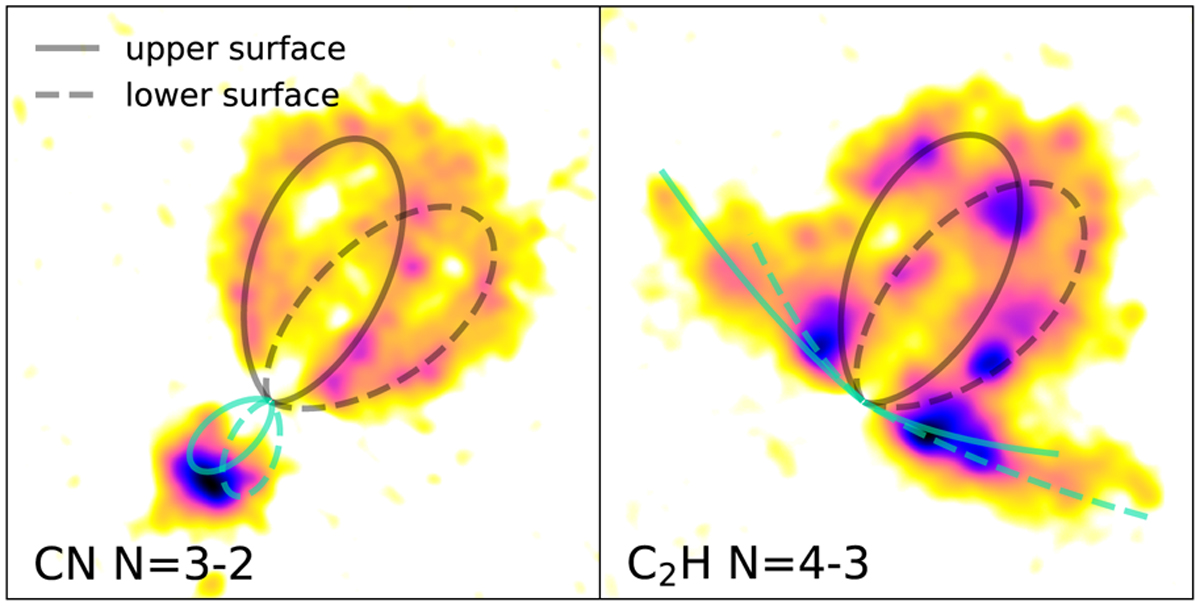
Channel map emission for CN (left) and C2H (right) at equal relative velocity to systemic motion (−1.2 km s−1). Continuous line traces the upper emission surface and dashed line the lower surface. Different colored contours indicate different hyperfine components. Contours are not fit to the data, they represent the visual identification of the emission surfaces and follow constant z/r (0.3 and 0.2 for CN and C2H, respectively).
Current usage metrics show cumulative count of Article Views (full-text article views including HTML views, PDF and ePub downloads, according to the available data) and Abstracts Views on Vision4Press platform.
Data correspond to usage on the plateform after 2015. The current usage metrics is available 48-96 hours after online publication and is updated daily on week days.
Initial download of the metrics may take a while.