Fig. D.1
Download original image
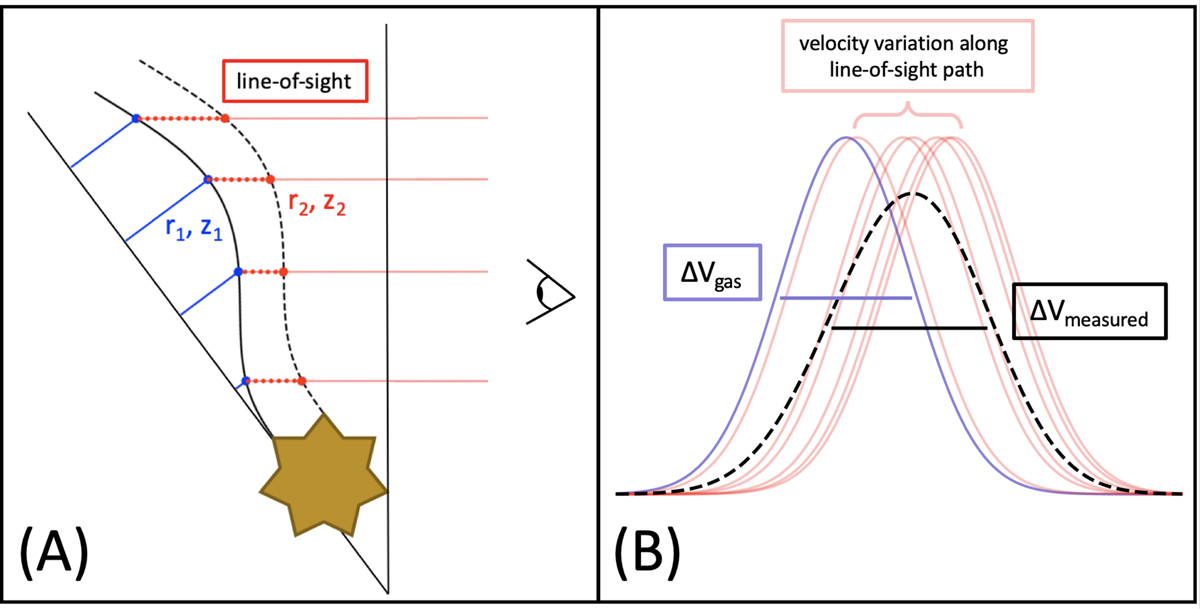
Sketch of the method used to estimate the effect of a nonzero vertical emitting width for CN. Panel (A) shows the geometry of CN emission in IM Lup, considering an inclination of 47.8° with respect to the observer. For the vertical structure, the solid curve indicates the best-fit vertical profile of CN emission and the dashed curve the extent considering a fixed vertical width. In each case, the blue dot is the observed parcel of gas at position (r1, z1) that has to cross the line-of-sight path as indicated by the red line, leaving the zone of CN emission at the red dot location (r2, z2) For different radial distances, the path varies. Panel (B) shows the velocity variation between the blue dot and the final red dot positions. Each solid-line Gaussian is centered at a determined velocity, depending on their (r, z) position along the line-of-sight path. The measured linewidth (ΔVmeasured) is taken from the resulting average Gaussian, shown as a dashed black curve and compared to the intrinsic value (ΔVgas).
Current usage metrics show cumulative count of Article Views (full-text article views including HTML views, PDF and ePub downloads, according to the available data) and Abstracts Views on Vision4Press platform.
Data correspond to usage on the plateform after 2015. The current usage metrics is available 48-96 hours after online publication and is updated daily on week days.
Initial download of the metrics may take a while.