Open Access
Fig. A.3
Download original image
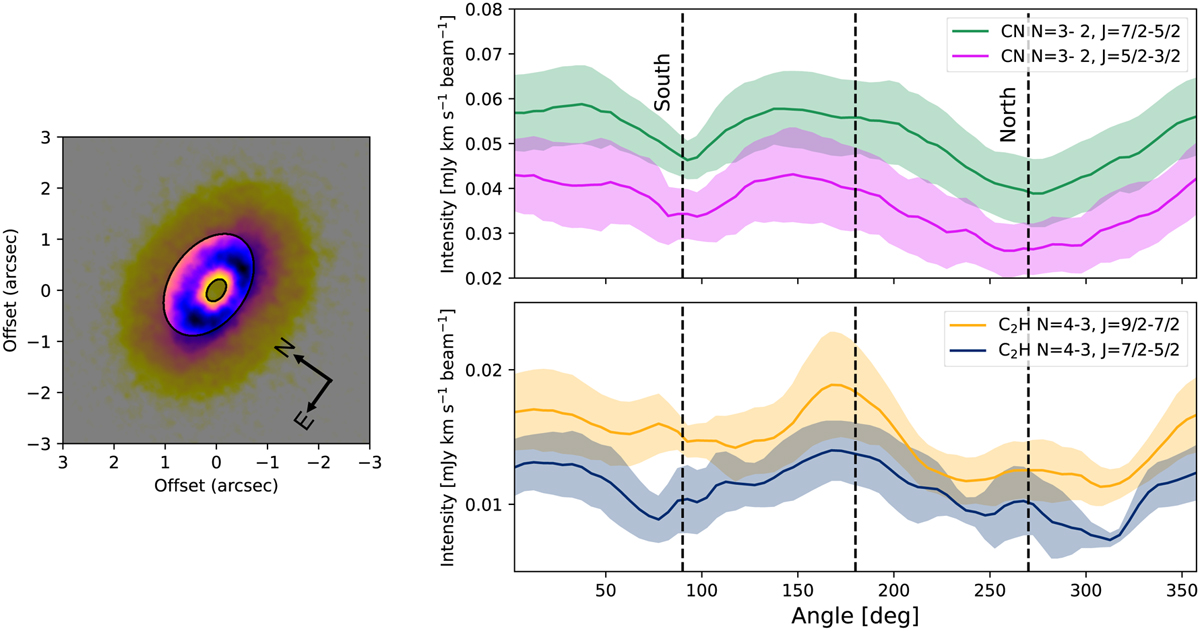
Azimuthal emission curves along the ring for each transition. The solid line indicates the mean values within each azimuthal bin and the shaded region the dispersion. The panel to the left shows the radial limits used to extract the ring emission.
Current usage metrics show cumulative count of Article Views (full-text article views including HTML views, PDF and ePub downloads, according to the available data) and Abstracts Views on Vision4Press platform.
Data correspond to usage on the plateform after 2015. The current usage metrics is available 48-96 hours after online publication and is updated daily on week days.
Initial download of the metrics may take a while.