Fig. A.2
Download original image
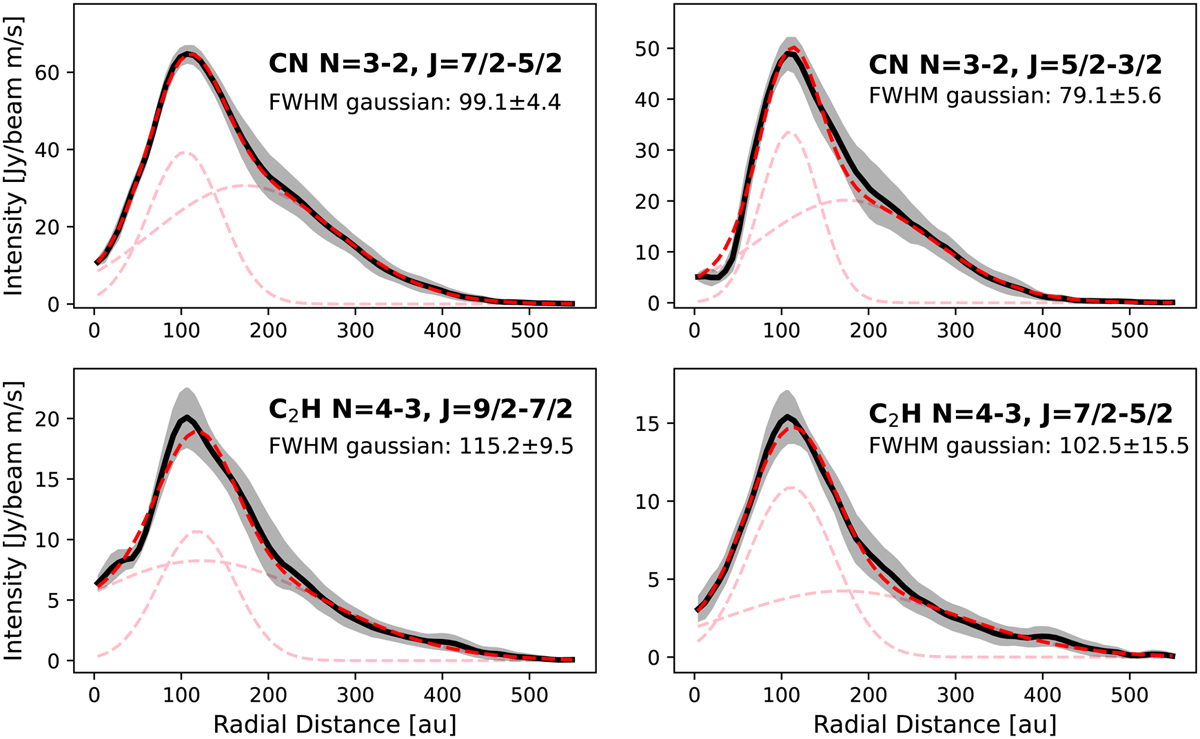
Gaussian fits to the radial intensity profiles of each transition. The data are shown in black, pink dashed lines trace the two individual Gaussian components, and the dashed red line presents the model curve, obtained by summing both Gaussians. The FWHM of the inner Gaussian, which traces the ring component, is indicated for each panel.
Current usage metrics show cumulative count of Article Views (full-text article views including HTML views, PDF and ePub downloads, according to the available data) and Abstracts Views on Vision4Press platform.
Data correspond to usage on the plateform after 2015. The current usage metrics is available 48-96 hours after online publication and is updated daily on week days.
Initial download of the metrics may take a while.