Open Access
Fig. A.1
Download original image
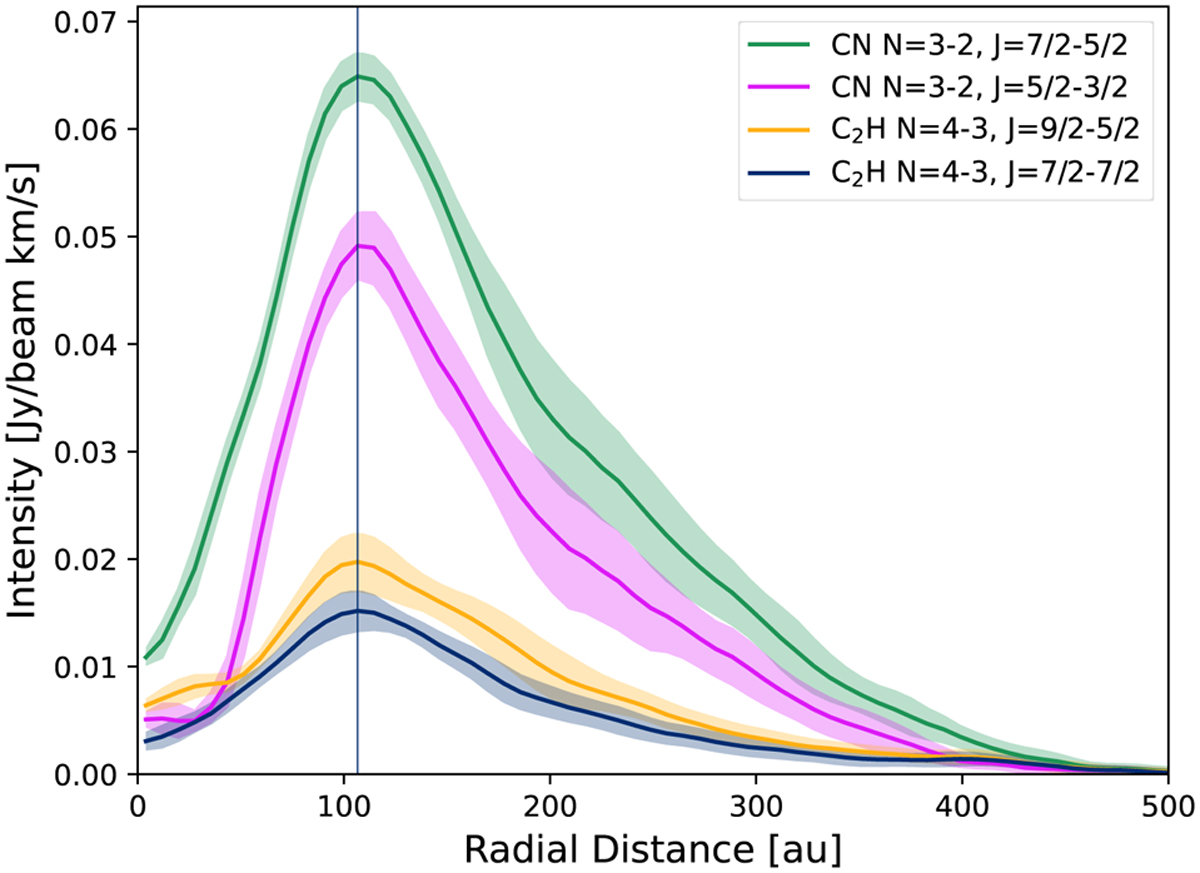
Azimuthally averaged radial intensity profiles for each of the observed hyperfine groups. The solid line traces the average value and the shaded region the dispersion within each radial bin. The vertical black line indicates the peak of emission, which coincides for all transitions at ~106 au.
Current usage metrics show cumulative count of Article Views (full-text article views including HTML views, PDF and ePub downloads, according to the available data) and Abstracts Views on Vision4Press platform.
Data correspond to usage on the plateform after 2015. The current usage metrics is available 48-96 hours after online publication and is updated daily on week days.
Initial download of the metrics may take a while.