Fig. 10
Download original image
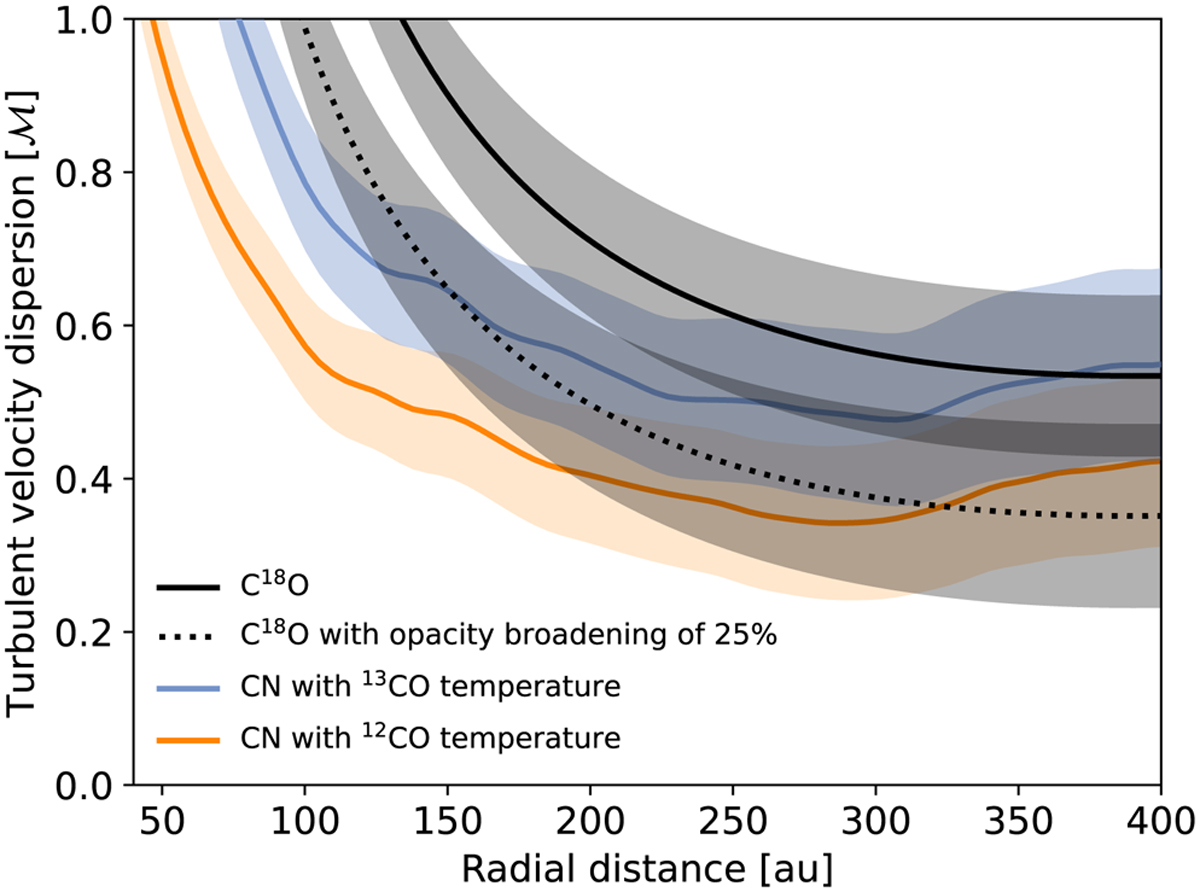
Same as Fig. 7, but including an analysis of the nonthermal component of C18O J = 2–1 data. The solid black line traces the results when applying the same methodology as previously used in CN to C18O. The dashed black line is the turbulence profile obtained after assuming a 25% opacity broadening in the measured linewidth, which may be the case if C18O has optical depths of 1–2.
Current usage metrics show cumulative count of Article Views (full-text article views including HTML views, PDF and ePub downloads, according to the available data) and Abstracts Views on Vision4Press platform.
Data correspond to usage on the plateform after 2015. The current usage metrics is available 48-96 hours after online publication and is updated daily on week days.
Initial download of the metrics may take a while.