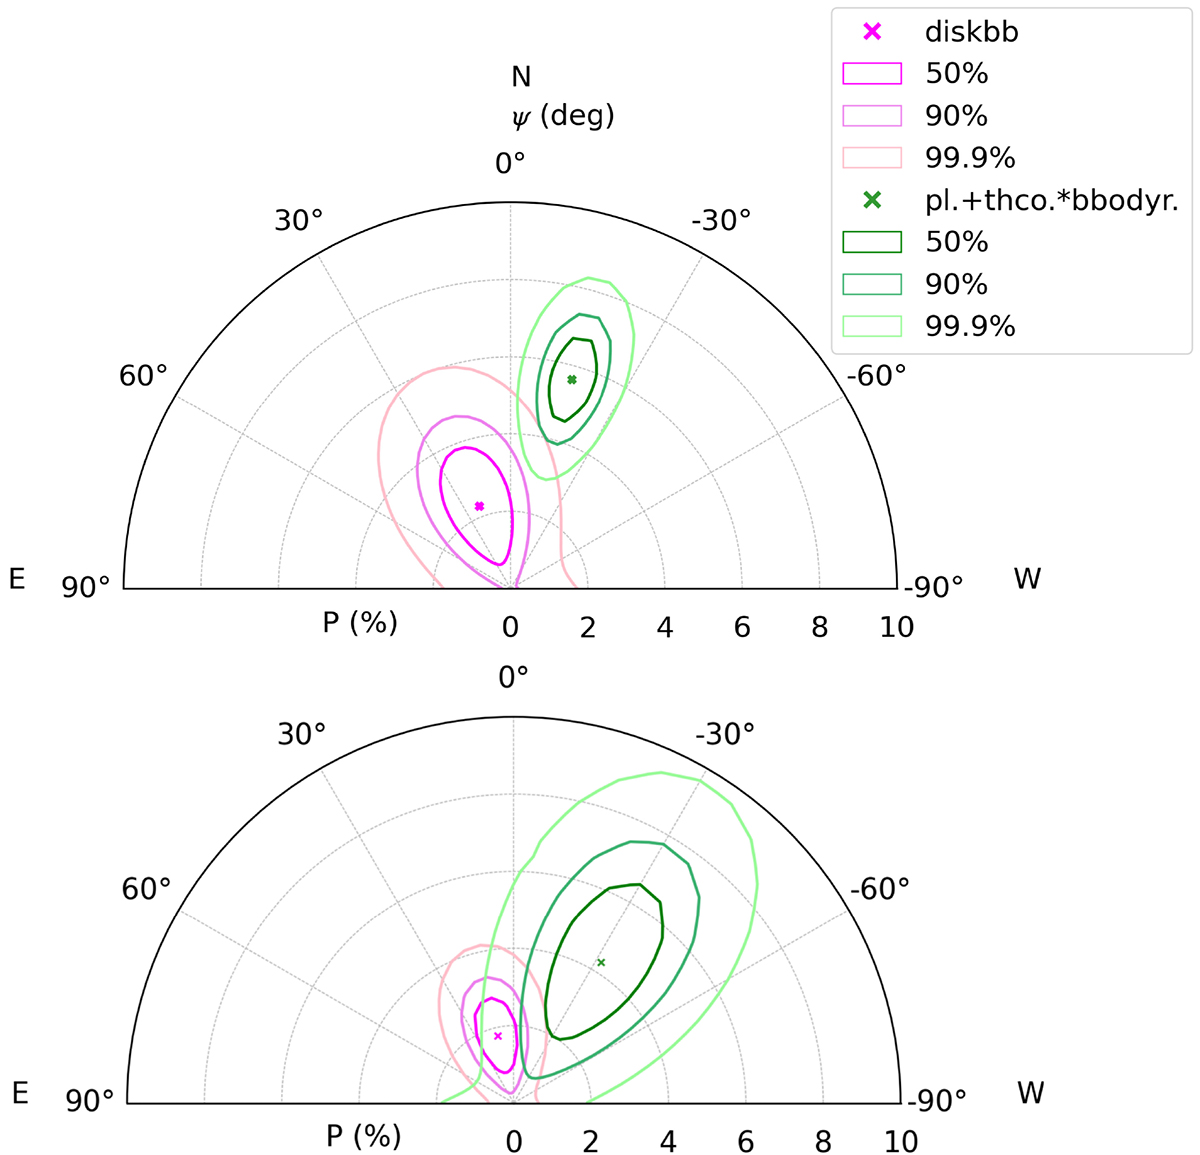
Fig. 7.

Download original image
Polarization contour plots from the spectropolarimetric analysis in the 2–8 keV energy range of Obs. 1 (top panel) and Obs. 2 (bottom panel). The polconst polarimetric model is applied separately to the diskbb component of both IXPE observations and to the (expabs*powerlaw+thcomp*bbodyrad) components as a whole. The expabs*powerlaw component (labeled pl. in the legend) is included only in Obs. 1. Contour plots are computed for the four parameters of interest, taking into account the fact that the polarization of the disk and Comptonization components are correlated in the simultaneous fit.
Current usage metrics show cumulative count of Article Views (full-text article views including HTML views, PDF and ePub downloads, according to the available data) and Abstracts Views on Vision4Press platform.
Data correspond to usage on the plateform after 2015. The current usage metrics is available 48-96 hours after online publication and is updated daily on week days.
Initial download of the metrics may take a while.


