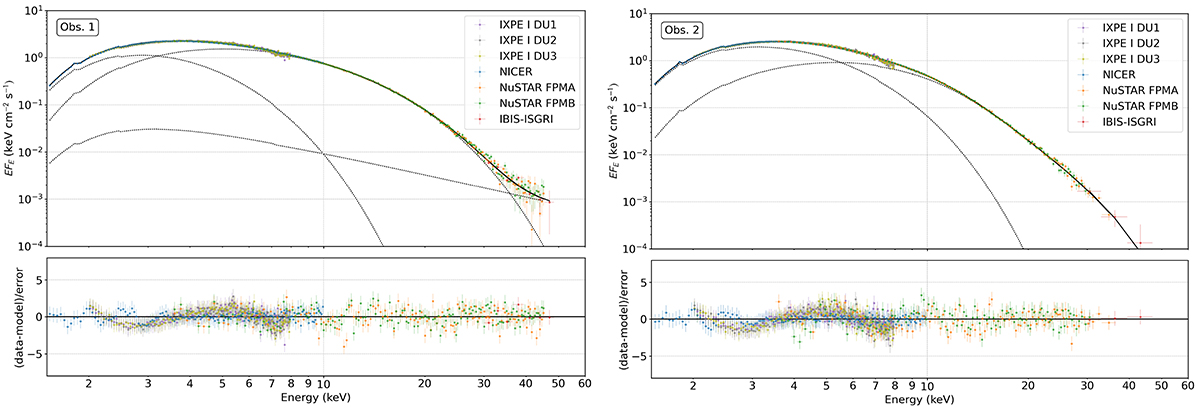
Fig. 6.
Download original image
Deconvolved energy spectrum of GX 5−1. The top panels show the deconvolved NICER (1.5–10 keV), NuSTAR (3.5–45 keV for Obs. 1 and 3.5–35 keV for Obs. 2), and IBIS/ISGRI (28–50 keV) spectra simultaneous with both IXPE observations, obtained from the best-fit model in Table 4. The IXPE (2–8 keV) energy spectrum is overplotted on the frozen model. The bottom panels show the residuals between data and model in units of σ.
Current usage metrics show cumulative count of Article Views (full-text article views including HTML views, PDF and ePub downloads, according to the available data) and Abstracts Views on Vision4Press platform.
Data correspond to usage on the plateform after 2015. The current usage metrics is available 48-96 hours after online publication and is updated daily on week days.
Initial download of the metrics may take a while.