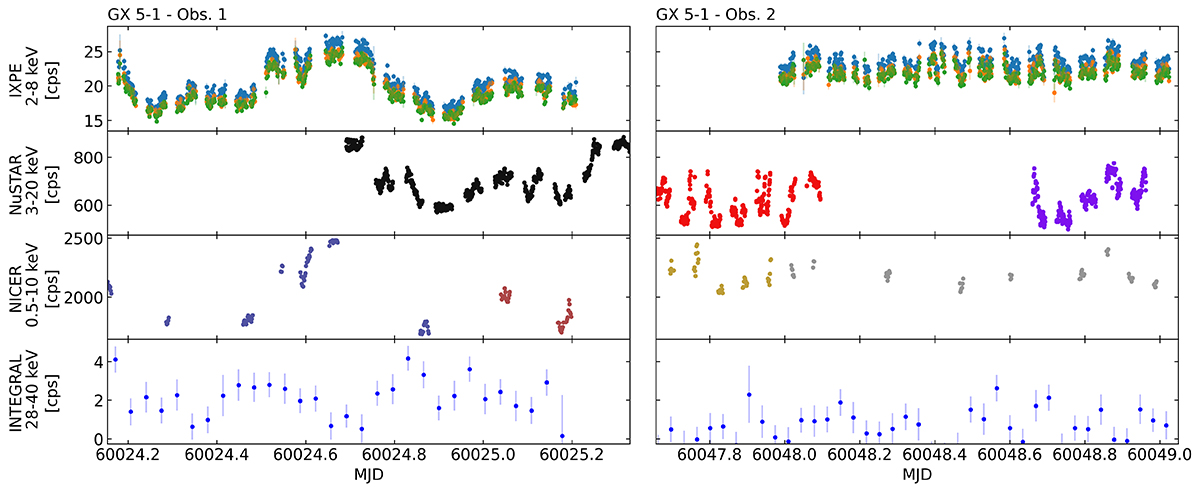
Fig. 1.
Download original image
Light curves of NuSTAR, NICER, and IBIS/ISGRI during IXPE Obs. 1 (left panel) and Obs. 2. (right panel). In the top row of each panel the three IXPE DU light curves are shown (DU1 blue, DU2 orange, and DU3 green). In the left panel the NICER soft purple and dark red points correspond to ObsID 6010230101 and 6010230102. In the right panel the NuSTAR red and purple points correspond to ObsIDs 90902310004 and 90902310006. The NICER gray points correspond to ObsID 6010230106.
Current usage metrics show cumulative count of Article Views (full-text article views including HTML views, PDF and ePub downloads, according to the available data) and Abstracts Views on Vision4Press platform.
Data correspond to usage on the plateform after 2015. The current usage metrics is available 48-96 hours after online publication and is updated daily on week days.
Initial download of the metrics may take a while.