| Issue |
A&A
Volume 684, April 2024
|
|
|---|---|---|
| Article Number | A39 | |
| Number of page(s) | 5 | |
| Section | Extragalactic astronomy | |
| DOI | https://doi.org/10.1051/0004-6361/202347213 | |
| Published online | 29 March 2024 | |
Measurement of the size of the gamma-ray source in blazar B0218+357 based on microlensing at the 100 GeV energy band
1
Institute for Cosmic Ray Research, The University of Tokyo, 5-1-5 Kashiwa-no-Ha, Kashiwa City, Chiba 277-8582, Japan
e-mail: This email address is being protected from spambots. You need JavaScript enabled to view it.
2
ISDC, Astronomy Department, University of Geneva, Ch. d’Ecogia 16, 1290 Versoix, Switzerland
Received:
16
June
2023
Accepted:
2
February
2024
Abstract
Context. Observations of the effect of microlensing in gravitationally lensed quasars can be used to study the structure of active galactic nuclei on distance scales down to the sizes of a supermassive black hole’s powering source activity.
Aims. We searched for a microlensing effect in the signal from a gravitationally lensed blazar, B0218+357, in a very-high-energy γ-ray band.
Methods. We combined observations of a bright flare of the source in 2014 by the Fermi Large Area Telescope and MAGIC telescopes in the 0.1 − 300 GeV and 65 − 175 GeV energy ranges, respectively. Using the time-delayed leading and trailing signals from two gravitationally lensed images of the source, we measured the magnification factor at the moment of the flare. We used the scaling of the maximal magnification factor with the source size to constrain the size of the γ-ray emission region in the wide 0.1 − 175 GeV energy range.
Results. The magnification factor in the very-high-energy band that we derived from our comparison of Fermi/LAT and MAGIC data is μVHE = 25−17+38, which is substantially larger than the factor found in the radio band. This suggests one of the source images is strongly affected by microlensing at the moment of the flare. Assuming that the microlensing is produced by a stellar mass object in the lens galaxy, we constrained the size of the emission region in the E > 100 GeV band to be RVHE = 6.6−5.6+69 × 1014 cm. We note that the spectrum of the microlensed source was unusually hard at the moment of the flare, and we speculate that this hardening may be due to the energy-dependent microlensing effect. This interpretation suggests that the source size decreases with energy in the entire 0.1 − 175 GeV energy range we studied.
Key words: gravitation / gravitational lensing: micro / galaxies: active / gamma rays: galaxies
© The Authors 2024
 Open Access article, published by EDP Sciences, under the terms of the Creative Commons Attribution License (https://creativecommons.org/licenses/by/4.0), which permits unrestricted use, distribution, and reproduction in any medium, provided the original work is properly cited.
This article is published in open access under the Subscribe to Open model. This email address is being protected from spambots. You need JavaScript enabled to view it. to support open access publication.
1. Introduction
Very-high-energy (VHE) emission from active galactic nuclei (AGN) can be affected by the effect of pair production on low-energy photon backgrounds (Gould & Schréder 1967) generated by accretion flows onto supermassive black holes. Conventional models of accretion on supermassive black holes at rates close to the Eddington limit suggest that emission from optically thick accretion flow at the distance R from the black hole has a temperature of kBT ∼ 10[Mbh/108 M⊙]1/4[R/Rg]−1/2 eV (Shakura & Sunyaev 1973; Neronov 2019), where Mbh is the black hole mass and Rg ≃ 1.5 × 10¹³[Mbh/108 M⊙] cm is the gravitational radius. The dense ϵ ∼ 10 eV photon background around the black hole can block the escape of γ-rays with energies Eγ ∼ 100[ϵ/10 eV]−1 GeV because such γ-rays produce electron-positron pairs in interactions with low-energy photons. Scattering of the ϵ ∼ 10 eV photons in the broad-line region (BLR; Peterson 2006) may affect the propagation of γ-rays on the scales RBLR ∼ 1017 cm ≫ Rg and at energies down to the gigaelectronvolt band (Poutanen & Stern 2010). Model calculation of the propagation of VHE γ-rays through radiation fields created by accretion flow and scattered in the BLR have led to a conjecture that γ-rays can only escape from a region outside the BLR situated in the parsec-scale jet ejected by the black hole (Ghisellini & Tavecchio 2009).
This conjecture has been challenged by observations of the fast variability of VHE γ-ray signals from some AGN (Aharonian et al. 2007; Berge et al. 2006; Aleksić et al. 2014b; Vovk & Neronov 2013). A causality argument suggests that the size of the electron acceleration region is limited to be R < ctvar ∼ 1014[tvar/1 h] cm if measured in the reference frame of the black hole (Neronov et al. 2008). Attempts to reconcile the short variability timescales with pair production constraints on the emission region size include models appealing to the delayed particle acceleration retaining the small-scale structure of the jet launch site (e.g., Kirk & Mochol 2011) or highly relativistic and compact emission regions embedded in extended parsec-scale jets (e.g., Begelman et al. 2008; Giannios et al. 2009; Lyutikov & Lister 2010). The origin of such compact regions remains obscure.
Very-high-energy γ-rays can escape from the vicinity of the black hole if the accretion proceeds through a radiatively inefficient accretion flow (RIAF) with luminosity orders of magnitude below the Eddington limit (Rees et al. 1982; Narayan & Yi 1994). Such accretion flows are found in nearby radio galaxies and farther away BL Lac-type objects. The RIAF luminosity is typically generated by optically thin synchrotron emission from mildly relativistic electrons in the accretion flow (Yuan & Narayan 2014). This emission is concentrated in the infrared band, and it does not present an obstacle for the escape of VHE γ-rays. In such cases, the fast variability of the γ-ray emission can be readily explained by particle acceleration close to the black hole at the base of the jet (Levinson 2000; Neronov & Semikoz 2003; Neronov & Aharonian 2007; Aleksić et al. 2014b; Ptitsyna & Neronov 2016).
It is difficult to determine the accretion mode on a source-by-source basis in blazars because both the infrared emission from RIAF and the optical-to-ultraviolet emission from optically thick accretion flow can be hidden behind much stronger Doppler-boosted emission from the relativistic jet. Only some of the brightest blazars of the flat spectrum radio quasar (FSRQ) type reveal the characteristic “big blue bumps” that are attributed to optically thick accretion disks (Courvoisier 1998; Wilkes 2004; D’Ammando et al. 2011; Aleksić et al. 2014a). Thus, it is not possible to directly measure the optical depth of the accretion flow and in this way constrain the location of the VHE γ-ray emission region by measuring the distance at which the optical depth for the pair production decreases below unity.
Nevertheless, a direct measurement of the size of an emission region at different wavelengths is possible in a special case of gravitationally lensed AGN through the phenomenon of microlensing (Blackburne et al. 2011; Dai et al. 2010). Microlensing occurs when stars in the lensing galaxy pass through the line of sight toward one of the images of the gravitationally lensed source, leading to temporary magnification of the image with a magnification factor that depends on the source size.
Two gravitationally lensed blazars have been detected in γ-rays: PKS 1830-211 (Abdo et al. 2015) and QSO B0218+357 (Cheung et al. 2014). In both sources, microlensing has been observed and proved to be efficient in constraining the size of the high-energy γ-ray source in the 0.1–10 GeV energy range1 (Neronov et al. 2015; Vovk & Neronov 2016).
An opportunity to constrain the emission region size at even higher energies arose with the QSO B0218+357 flare detection in the 65 − 175 GeV energy range with the MAGIC telescopes (Ahnen et al. 2016). This source, at redshift z = 0.944 ± 0.002 (Cohen et al. 2000), has two images, A and B (Patnaik et al. 1995), with the flux from image B delayed by 11.4 ± 0.2 d with respect to image A (Biggs & Browne 2018). However, MAGIC observations covered only the trailing image B flare, precluding the corresponding microlensing magnitude constraint from MAGIC data alone.
In this work, we report a Fermi/LAT (Atwood et al. 2009; Cheung et al. 2014) detection of the leading B0218+357 flare corresponding to the MAGIC measurements (Ahnen et al. 2016) in an overlapping energy range up to E ≈ 300 GeV. Combining the Fermi/LAT and MAGIC data, we derive the magnification factor at the E ∼ 100 GeV energy range and compare it with the factor derived in the radio band (which is not affected by microlensing), presenting the first evidence for the microlensing effect in B0218+357 operating in the VHE band. We further use this measurement to constrain the size of the γ-ray source.
2. Data analysis
We used the publicly available Pass 8 reprocessed photon data set from the Fermi/LAT telescope2. The data were analyzed using the Fermitools package and FermiPy framework3 v0.17.3 (Wood et al. 2017) as described in the FermiPy documentation4, using the SOURCE event class and P8R3_SOURCE_V3 response functions. The photons were selected from the 20° region around the position of B0218+357. The fluxes of all the sources in the selected region were estimated from the unbinned likelihood fit, which included all the sources from the 4FGL (Abdollahi et al. 2020) catalog within 35 degrees from B0218+357 as well as the galactic (gll_iem_v07.fits) and extragalactic (iso_P8R3_SOURCE_V3_v1.txt) diffuse backgrounds. All the background and the 4FGL source parameters were allowed to vary. Low-significance (with detection test statistics TS ≲ 3) sources were not excluded and also optimized during the fit.
We focused on a flaring episode of the source in the MJD 56851–56865 range, during which a hard source spectrum was reported in the high-energy band 0.1–10 GeV (Buson et al. 2015). Only the leading flare from the image A (MJD 56851.62–56853.62) was significantly detected by Fermi/LAT during this episode. The measured flux above 100 MeV during the expected trailing flare B (MJD 56863.08–56865.08) remained consistent with the non-flaring state (Vovk & Neronov 2016). The trailing flare B was previously detected by the MAGIC telescope in the energy range above 100 GeV (Ahnen et al. 2016). However, the MAGIC observations did not cover the leading flare A, and hence a direct measurement of the magnification factor in the VHE band was not possible.
In the gigaelectronvolt band, a non-negligible contribution from the leading flare may be expected during the anticipated time window of flare B. In order to account for it when searching for the flare B emission with Fermi/LAT, we combined in a joint fit the time interval including the expected trailing flare (MJD 56863.08–56865.08), the interval between the flares (MJD 56853.62–56863.08), and the interval after the trailing flare (MJD 56865.08–56875.08). During the fit, we allowed for an additional log-parabola component during the first time interval to account for the putative flare B contribution, while the remaining sources, including the baseline model for flare A, were jointly optimized over all three intervals.
The result of our re-analysis of the broadband γ-ray spectrum of the source during the leading and trailing flares is shown in Fig. 1. The derived spectrum of the leading flare extends up to 300 GeV (TS ≈ 25 in the 100 − 300 GeV energy bin) and is well described by a log-parabola shape
 (1)
(1)
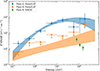 |
Fig. 1. Reconstructed spectral energy distribution of B0218+357 during the MJD 56851–56865 flaring episode from the Fermi/LAT data. Blue data points and band represent the leading flare emission derived here, whereas the orange ones correspond to the trailing emission component. Green data points represent the MAGIC measurements of the trailing component (Ahnen et al. 2016). An open circle data point represent the Fermi/LAT flux extracted in the 65 − 175 GeV energy range and with the Γ = −3.8 spectral slope corresponding to the MAGIC measurements. |
with N0 = (1.14 ± 0.27)×1010 ph cm−2 s MeV; β = −0.14 ± 0.06; the break energy fixed to the 4GLF value of Eb = 778 MeV; and a remarkably hard index of Γ = −0.88 ± 0.26. The log-parabola is statistically preferred over a power law at ≈3σ level (TS ≈ 10). When fit with a power-law spectral model in the narrower energy range of 0.1 − 30 GeV, motivated by the turnover point of the best-fit log-parabola, a similarly hard slope of Γ = −1.16 ± 0.20 is found. The trailing flare B, at the same time, was indeed not detected on top of the baseline emission during the expected time window (TS ≈ 4.9; the best-fit normalization of the trailing flare flux at the reference energy Eb is 2.2 ± 1.4 times smaller than that of the baseline and 10.0 ± 6.5 times smaller than that of leading flare). This finding does not contradict the positive detection of the total (baseline and flaring) flux below 100 GeV reported based on Fermi/LAT data earlier (Ahnen et al. 2016). The derived flux upper limits at the 95% confidence level are consistent with the MAGIC detection at the same energies (Ahnen et al. 2016). Detection of the VHE γ-ray flux from the leading flare with Fermi/LAT enables a straightforward measurement of the VHE band magnification factor ratio via comparison of the flare A flux with Fermi/LAT and the flare B flux with MAGIC, as described in the next section.
3. Microlensing in the very-high-energy band
The spectral energy distributions of the leading and trailing flares, depicted in Fig. 1, enable the gravitational lensing magnification factor μ estimate in several ways. A straightforward estimate of the magnification factor can be obtained from the ratio of the leading to trailing components’ extracted fluxes in separate energy bins, shown in Fig. 1. To properly account for the measurement uncertainties, we used the log-likelihood profiles automatically extracted by FermiPy as a function of the flux normalization for every data point. Parametrizing the trailing and leading fluxes as F and μF, we used the total log-likelihood L(F, μ), marginalized over F, to estimate the lower limits on μ at the 90% confidence level. The energy-dependent magnification bound derived this way reaches μ ≳ 15 in the 10 − 31.6 GeV energy bin. At higher energies, Fermi/LAT measurements of leading and trailing fluxes are consistent within the uncertainties.
By combining the Fermi/LAT and MAGIC measurements, it is also possible to directly measure the magnification factor in the 65 − 175 GeV energy range where the VHE emission of flare B was detected. In this study we compared a weighted average of the MAGIC flux data points with the Fermi/LAT measurement in that entire energy range to compensate for its lack of sensitivity in the individual MAGIC energy bins. We calculated the weighted average of the flux data points as fi  , assuming the Gaussian nature of the corresponding uncertainties σi, and re-calculated the Fermi/LAT flux using the Γ = −3.8 spectral slope found in the MAGIC data (Ahnen et al. 2016). Using the same procedure as above but this time using the Gaussian likelihood for the combined MAGIC data point, we found
  in this energy range (the uncertainties correspond to the 68% confidence interval). The uncertainty of this estimate is dominated by that of the Fermi/LAT measurement and does not change if a systematic uncertainty on Fermi/LAT (≃10%; Ackermann et al. 2012) or MAGIC (≃20%; Aleksić et al. 2016) fluxes is accounted for. At the same time, the spectral slope of the leading flare in the 65 − 175 GeV energy range could have been harder than the one measured by MAGIC for the trailing flare, producing a notable effect on the derived flux; for example, when assuming Γ = −2.0, we found a ≈40% larger leading flare flux yielding a correspondingly larger magnification factor.
Finally, the remarkable hardness of the leading flare emission in the 0.1 − 30 GeV energy range may itself be attributed to the gravitational lensing phenomenon, modifying the spectrum in the energy-dependent manner. The γ-ray spectra of blazars, roughly represented by the power law dNγ/dEγ ∝ E−Γ, are characterized by spectral slopes Γ > 1.5, with rare exceptions, such as the flaring state of Mrk 501 (Neronov et al. 2012). Assuming the intrinsic source spectrum has the hardest conventionally assumed spectral index of Γmin = 1.5, the energy-dependent gravitational lensing influence can be estimated from the ratio of the measured source fluxes to the dN/dE ∼ E−Γmin approximation. It should be noted, though, that such an estimate based only on the leading flare A emission only reflects the energy dependency of the magnification factor μ and not its overall scale. The latter needs to be derived separately. In this study we normalized the obtained scaling to the magnification factor in the ∼0.1 − 10 GeV energy range that was derived for the earlier source flare (Vovk & Neronov 2016).
The magnification factor ratio derived from the comparison of Fermi/LAT and MAGIC data is larger than the radio band magnification factor ratio between images A and B, μr ≃ 4 (Mittal et al. 2007), a result which can be attributed to the influence of microlensing (Vovk & Neronov 2016). Microlensing hardly affects radio sources that are resolved and are known to have a multi-parsec size. Such a large source cannot be magnified by the effect of microlensing on stars in the lensing galaxy, as microlensing only affects sources with sizes smaller than the size of the Einstein ring,
![Mathematical equation: $$ \begin{aligned} R_{\rm E}= \sqrt{\frac{4GM}{c^2}\frac{D_{\rm LS} D_{\rm S}}{D_{\rm L}}} \simeq 3\times 10^{16} \left[ \frac{M}{M_\odot }\right]^{1/2}\left[\frac{D}{1\,\mathrm{Gpc}} \right]^{1/2}\,\mathrm{cm}, \end{aligned} $$](/articles/aa/full_html/2024/04/aa47213-23/aa47213-23-eq6.gif) (2)
(2)
where DL, DS, and DLS are distances to the lens, source, and between the lens and the source; D ∼ DL ∼ DLS is the order-of-magnitude distance estimate; and M is the mass of the object responsible for the microlensing. Microlensing could have affected the γ-ray source flux during the flare if the γ-ray source size was smaller than RE.
The relation between the microlensing magnification factor and the source size is
![Mathematical equation: $$ \begin{aligned} \mu _{\rm ml}=\sqrt{\frac{R_{\rm E}}{R_\gamma }}\simeq 10\left[\frac{R_\gamma }{3\times 10^{14}\,\mathrm{cm}}\right]^{-1/2}\left[\frac{M}{M_\odot }\right]^{1/4}\left[\frac{D}{1\,\mathrm{Gpc}}\right]^{-1/4}. \end{aligned} $$](/articles/aa/full_html/2024/04/aa47213-23/aa47213-23-eq7.gif) (3)
(3)
When comparing the radio magnification factor with the one from the γ-ray band during the flare, one can find an estimate of the microlensing effect μml = μvhe/μr, and by using Eq. (3), one can estimate the source size in the 0.1 − 175 GeV γ-ray band. The result of such estimates is shown in Fig. 2. One can see that the size of the VHE emission region is found to be very compact, with  5.
5.
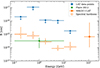 |
Fig. 2. Reconstructed emission region size in B0218+357 as a function of energy. Blue upper limits were derived from the ratio of the leading and trailing components fluxes; solid orange data point represents the source size measurement stemming from Fermi/LAT and MAGIC detection of the ∼100 GeV emission from the leading and trailing components correspondingly. Open orange circles represent the source size energy scaling, required to explain the extreme hardness of the measured leading component spectrum. Green data point marks the source size measurement during the 2012 flare of B0218+357 (Vovk & Neronov 2016). |
The source size estimate in the VHE band is somewhat smaller than in the high-energy (0.1–10 GeV) band. This indicates a possibility that source size is actually shrinking with increasing energy. Such a decreasing source size may well be responsible for the unusually hard spectrum of the source observed durin the leading flare. Indeed, as one can see from Fig. 2, the required source size scaling is consistent with the measurements in high-energy and VHE bands.
4. Discussion
The compactness of the VHE γ-ray source inferred from the observation of the microlensing effect may pose a problem of opacity of the γ-ray source to the pair production on low-energy photon backgrounds from the accretion flow. In the case of B0218+357, the parameters of the accretion flow are not well constrained. It is not clear at what rate the source accretes because no spectral signatures of either radiatively efficient accretion at near-Eddington rates (the “big blue bump” in the optical-to-ultraviolet spectrum) or of a RIAF (a bump due to synchrotron emission in the infrared spectrum) are detectable. The modeling of Acciari et al. (2022) suggests that infrared-to-ultraviolet flux from the AGN is dominated by the synchrotron emission from a relativistic jet, supposedly from its part at distances from Rjet ∼ 2 × 1017 cm to 3 × 1020 cm from the black hole.
The γ-rays arriving at Earth with energies of Eγ ≃ 100 GeV are emitted from the source with energies E′=E(1 + z)≃200 GeV. Such photons are most efficiently absorbed in pair production on blue-to-ultraviolet photons with energies ϵ′≃5 eV that reach the Earth with the energy ϵ = ϵ′/(1 + z)≃2.5 eV. An estimate of the power-law flux at 2.5 eV is Fv ≃ 2 × 10⁻¹⁴ erg cm−2 s (Acciari et al. 2022), so the intrinsic source luminosity is  erg s−1. If this emission comes from a source with the size Rv ∼ Rjet ≥ 1017 cm from the black hole (as in the modeling of Acciari et al. 2022), the density of the visible-to-UV photons is nv = 108[Lv/1044 erg s−1][ϵ′/5 eV]−1[Rv/1017 cm]−2 cm−3. The mean free path of E′ = 200 GeV γ-rays through such a soft photon background, λγ ≃ 1017[Lv/1044 erg s−1]−1[ϵ′/5 eV][Rv/1017 cm]2 cm, is comparable to the extent of the source responsible for visible-to-ultraviolet emission. Thus, the VHE γ-ray flux can be moderately affected by the pair production on the visible-to-ultraviolet photon background generated by the jet. The optical depth for the γ-rays is τ100 GeV = Rv/λγ ≃ 1[Lv/1044 erg s−1][Rv/1017 cm]−1, and the VHE γ-rays can escape from the source. It is possible that a more compact visible light emission from the accretion flow still gives a sub-dominant contribution to the observed source flux. The condition τ100 GeV ≲ 1 on the transparency of the source for the 100 GeV γ-rays constrains parameters of an otherwise undetectable accretion flow component: Lv ≲ 1044[Rv/1017 cm] erg s−1.
The size of the VHE emission region, inferred in this work from the microlensing detection in the 65 − 175 GeV energy band, is consistent with an earlier measurement in the gigaelectronvolt band (Vovk & Neronov 2016) and suggests the extreme compactness of the gamma-ray emission region in B0218+357. It should be noted that this conclusion assumes microlensing operates on stars within the lensing galaxy, whereas it is possible it may originate from much larger structures within it. The corresponding emission region size, microlensed by giant molecular clouds with M ∼ 105 M⊙, would be  . While there are indications that the odds of such lensing may be enhanced in the B0218+357 system (Sitarek & Bednarek 2016), its chance probability is still much lower than what has been found in the case of stellar lensing (Vovk & Neronov 2016).
Gravitational microlensing, operating in the entire 1 − 100 GeV band, may also provide a natural explanation for the extreme hardness (Γ < 1.5) of the B0218+357 flare A spectrum. The origin of such hardness, which has been found in a few rare cases, is uncertain, and several explanations have been put forward (Lefa et al. 2011; Neronov et al. 2012). However, in the case of B0218+357, it may be a mere consequence of the evolving with energy emission region size resulting in an energy-dependent magnification due to microlensing. This assumption can be verified if in the next occurrence both leading and trailing flares of the source would be measured, enabling a direct comparison of their spectral shapes.
The estimates of the B0218+357 gamma-ray emission size are limited by the small number of photons detected by Fermi/LAT during the MJD 56851–56865 flaring episode. However, the hardness of the spectrum and MAGIC detection of the trailing flare in the VHE band suggest that during such flares, the source may be readily observable with ground-based gamma-ray telescopes greatly exceeding Fermi/LAT in collection area. This makes B0218+357 flares an interesting target for observations with the next-generation Cherenkov Telescope Array instrument (Actis et al. 2011).
Though Vovk & Neronov (2016) performed analysis in the wider 0.1–510 GeV energy range while studying B0218+357, the event counts in their light curve are dominated by low-energy photons, with the contribution of those above 10 GeV estimated to be ≲5%.
The highly non-symmetric error bars on RVHE stem from its  scaling given the relatively large uncertainties on the derived μml in the 65 − 175 GeV energy range.
Acknowledgments
I.V. gratefully acknowledges the support of the Institute for Cosmic Ray Research (ICRR), the University of Tokyo in realization of this study.
References
- Abdo, A. A., Ackermann, M., Ajello, M., et al. 2015, ApJ, 799, 143 [Google Scholar]
- Abdollahi, S., Acero, F., Ackermann, M., et al. 2020, ApJS, 247, 33 [Google Scholar]
- Acciari, V. A., Ansoldi, S., Antonelli, L. A., et al. 2022, MNRAS, 510, 2344 [NASA ADS] [CrossRef] [Google Scholar]
- Ackermann, M., Ajello, M., Albert, A., et al. 2012, ApJS, 203, 4 [Google Scholar]
- Actis, M., Agnetta, G., Aharonian, F., et al. 2011, Exp. Astron., 32, 193 [NASA ADS] [CrossRef] [Google Scholar]
- Aharonian, F., Akhperjanian, A. G., Bazer-Bachi, A. R., et al. 2007, ApJ, 664, L71 [NASA ADS] [CrossRef] [Google Scholar]
- Ahnen, M. L., Ansoldi, S., Antonelli, L. A., et al. 2016, A&A, 595, A98 [NASA ADS] [CrossRef] [EDP Sciences] [Google Scholar]
- Aleksić, J., Ansoldi, S., Antonelli, L. A., et al. 2014a, A&A, 569, A46 [NASA ADS] [CrossRef] [EDP Sciences] [Google Scholar]
- Aleksić, J., Ansoldi, S., Antonelli, L. A., et al. 2014b, Science, 346, 1080 [Google Scholar]
- Aleksić, J., Ansoldi, S., Antonelli, L. A., et al. 2016, ApJ, 72, 76 [Google Scholar]
- Atwood, W. B., Abdo, A. A., Ackermann, M., et al. 2009, ApJ, 697, 1071 [CrossRef] [Google Scholar]
- Begelman, M. C., Fabian, A. C., & Rees, M. J. 2008, MNRAS, 384, L19 [CrossRef] [Google Scholar]
- Berge, D., Bernlöhr, K., Boisson, C., et al. 2006, Science, 314, 1424 [NASA ADS] [CrossRef] [Google Scholar]
- Biggs, A. D., & Browne, I. W. A. 2018, MNRAS, 476, 5393 [CrossRef] [Google Scholar]
- Blackburne, J. A., Pooley, D., Rappaport, S., & Schechter, P. L. 2011, ApJ, 729, 34 [Google Scholar]
- Buson, S., Cheung, C. C., Larsson, S., & Scargle, J. D. 2015, arXiv e-prints [arXiv:1502.03134] [Google Scholar]
- Cheung, C. C., Larsson, S., Scargle, J. D., et al. 2014, ApJ, 782, L14 [NASA ADS] [CrossRef] [Google Scholar]
- Cohen, A. S., Hewitt, J. N., Moore, C. B., & Haarsma, D. B. 2000, ApJ, 545, 578 [NASA ADS] [CrossRef] [Google Scholar]
- Courvoisier, T. J. L. 1998, A&ARv, 9, 1 [NASA ADS] [CrossRef] [Google Scholar]
- Dai, X., Kochanek, C. S., Chartas, G., et al. 2010, ApJ, 709, 278 [Google Scholar]
- D’Ammando, F., Raiteri, C. M., Villata, M., et al. 2011, A&A, 529, A145 [CrossRef] [EDP Sciences] [Google Scholar]
- Ghisellini, G., & Tavecchio, F. 2009, MNRAS, 397, 985 [Google Scholar]
- Giannios, D., Uzdensky, D. A., & Begelman, M. C. 2009, MNRAS, 395, L29 [NASA ADS] [CrossRef] [Google Scholar]
- Gould, R. J., & Schréder, G. P. 1967, Phys. Rev., 155, 1404 [Google Scholar]
- Kirk, J. G., & Mochol, I. 2011, ApJ, 729, 104 [NASA ADS] [CrossRef] [Google Scholar]
- Lefa, E., Rieger, F. M., & Aharonian, F. 2011, ApJ, 740, 64 [NASA ADS] [CrossRef] [Google Scholar]
- Levinson, A. 2000, Phys. Rev. Lett., 85, 912 [NASA ADS] [CrossRef] [Google Scholar]
- Lyutikov, M., & Lister, M. 2010, ApJ, 722, 197 [NASA ADS] [CrossRef] [Google Scholar]
- Mittal, R., Porcas, R., & Wucknitz, O. 2007, A&A, 465, 405 [NASA ADS] [CrossRef] [EDP Sciences] [Google Scholar]
- Narayan, R., & Yi, I. 1994, ApJ, 428, L13 [Google Scholar]
- Neronov, A. 2019, J. Phys. Conf. Ser., 1263, 012001 [NASA ADS] [CrossRef] [Google Scholar]
- Neronov, A., & Aharonian, F. A. 2007, ApJ, 671, 85 [NASA ADS] [CrossRef] [Google Scholar]
- Neronov, A., & Semikoz, D. 2003, Nat. Astron., 47, 693 [Google Scholar]
- Neronov, A., Semikoz, D., & Sibiryakov, S. 2008, MNRAS, 391, 949 [CrossRef] [Google Scholar]
- Neronov, A., Semikoz, D., & Taylor, A. M. 2012, A&A, 541, A31 [NASA ADS] [CrossRef] [EDP Sciences] [Google Scholar]
- Neronov, A., Vovk, I., & Malyshev, D. 2015, Nat. Phys., 11, 664 [CrossRef] [Google Scholar]
- Patnaik, A. R., Porcas, R. W., & Browne, I. W. A. 1995, MNRAS, 274, L5 [NASA ADS] [CrossRef] [Google Scholar]
- Peterson, B. 2006, Lect. Notes Phys., 693 [Google Scholar]
- Poutanen, J., & Stern, B. 2010, ApJ, 717, L118 [Google Scholar]
- Ptitsyna, K., & Neronov, A. 2016, A&A, 593, A8 [NASA ADS] [CrossRef] [EDP Sciences] [Google Scholar]
- Rees, M. J., Begelman, M. C., Blandford, R. D., & Phinney, E. S. 1982, Nature, 295, 17 [CrossRef] [Google Scholar]
- Shakura, N. I., & Sunyaev, R. A. 1973, A&A, 24, 337 [NASA ADS] [Google Scholar]
- Sitarek, J., & Bednarek, W. 2016, MNRAS, 459, 1959 [NASA ADS] [CrossRef] [Google Scholar]
- Vovk, I., & Neronov, A. 2013, ApJ, 767, 103 [NASA ADS] [CrossRef] [Google Scholar]
- Vovk, I., & Neronov, A. 2016, A&A, 586, A150 [NASA ADS] [CrossRef] [EDP Sciences] [Google Scholar]
- Wilkes, B. 2004, in AGN Physics with the Sloan Digital Sky Survey, eds. G. T. Richards, & P. B. Hall, ASP Conf. Ser., 311, 37 [NASA ADS] [Google Scholar]
- Wood, M., Caputo, R., Charles, E., et al. 2017, 35th International Cosmic Ray Conference (ICRC2017), 301, 824 [Google Scholar]
- Yuan, F., & Narayan, R. 2014, ARA&A, 52, 529 [NASA ADS] [CrossRef] [Google Scholar]
All Figures
|
Fig. 1. Reconstructed spectral energy distribution of B0218+357 during the MJD 56851–56865 flaring episode from the Fermi/LAT data. Blue data points and band represent the leading flare emission derived here, whereas the orange ones correspond to the trailing emission component. Green data points represent the MAGIC measurements of the trailing component (Ahnen et al. 2016). An open circle data point represent the Fermi/LAT flux extracted in the 65 − 175 GeV energy range and with the Γ = −3.8 spectral slope corresponding to the MAGIC measurements. |
| In the text | |
|
Fig. 2. Reconstructed emission region size in B0218+357 as a function of energy. Blue upper limits were derived from the ratio of the leading and trailing components fluxes; solid orange data point represents the source size measurement stemming from Fermi/LAT and MAGIC detection of the ∼100 GeV emission from the leading and trailing components correspondingly. Open orange circles represent the source size energy scaling, required to explain the extreme hardness of the measured leading component spectrum. Green data point marks the source size measurement during the 2012 flare of B0218+357 (Vovk & Neronov 2016). |
| In the text | |
Current usage metrics show cumulative count of Article Views (full-text article views including HTML views, PDF and ePub downloads, according to the available data) and Abstracts Views on Vision4Press platform.
Data correspond to usage on the plateform after 2015. The current usage metrics is available 48-96 hours after online publication and is updated daily on week days.
Initial download of the metrics may take a while.