Fig. 2.
Download original image
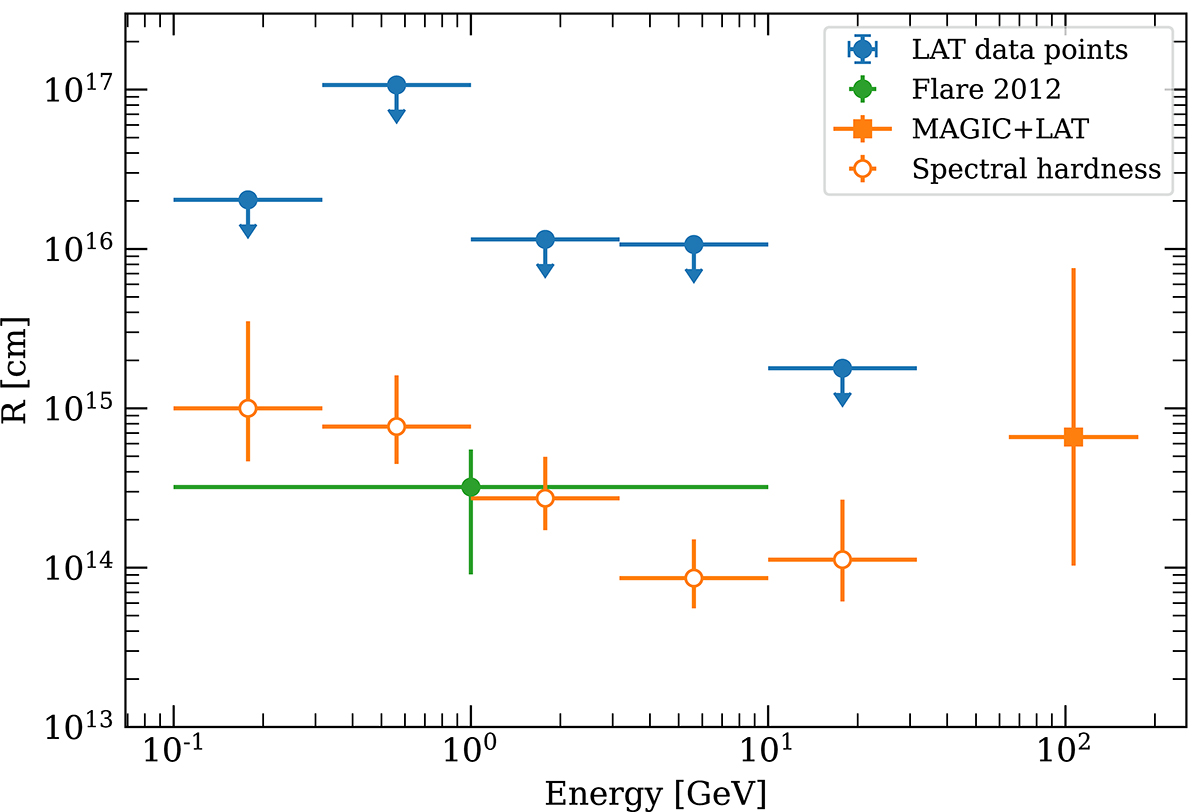
Reconstructed emission region size in B0218+357 as a function of energy. Blue upper limits were derived from the ratio of the leading and trailing components fluxes; solid orange data point represents the source size measurement stemming from Fermi/LAT and MAGIC detection of the ∼100 GeV emission from the leading and trailing components correspondingly. Open orange circles represent the source size energy scaling, required to explain the extreme hardness of the measured leading component spectrum. Green data point marks the source size measurement during the 2012 flare of B0218+357 (Vovk & Neronov 2016).
Current usage metrics show cumulative count of Article Views (full-text article views including HTML views, PDF and ePub downloads, according to the available data) and Abstracts Views on Vision4Press platform.
Data correspond to usage on the plateform after 2015. The current usage metrics is available 48-96 hours after online publication and is updated daily on week days.
Initial download of the metrics may take a while.