Fig. 1.
Download original image
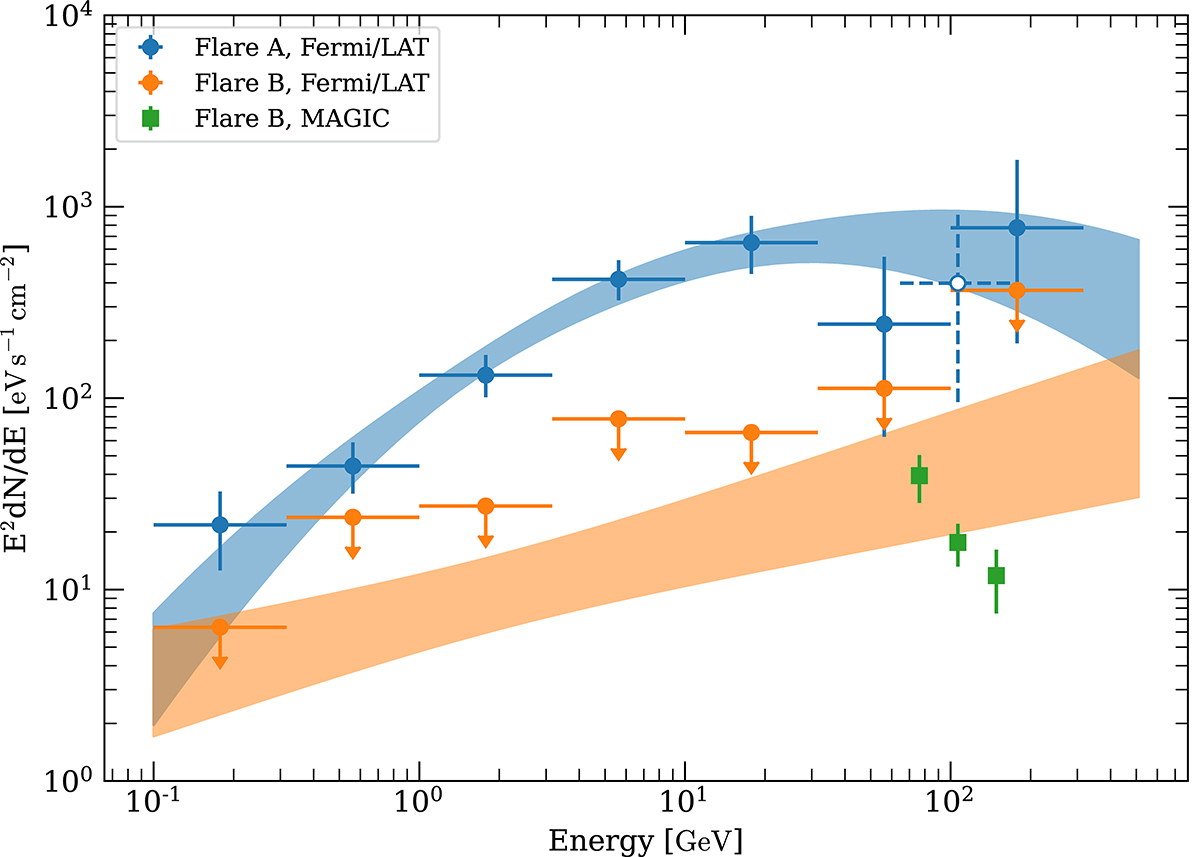
Reconstructed spectral energy distribution of B0218+357 during the MJD 56851–56865 flaring episode from the Fermi/LAT data. Blue data points and band represent the leading flare emission derived here, whereas the orange ones correspond to the trailing emission component. Green data points represent the MAGIC measurements of the trailing component (Ahnen et al. 2016). An open circle data point represent the Fermi/LAT flux extracted in the 65 − 175 GeV energy range and with the Γ = −3.8 spectral slope corresponding to the MAGIC measurements.
Current usage metrics show cumulative count of Article Views (full-text article views including HTML views, PDF and ePub downloads, according to the available data) and Abstracts Views on Vision4Press platform.
Data correspond to usage on the plateform after 2015. The current usage metrics is available 48-96 hours after online publication and is updated daily on week days.
Initial download of the metrics may take a while.