Fig. 5.
Download original image
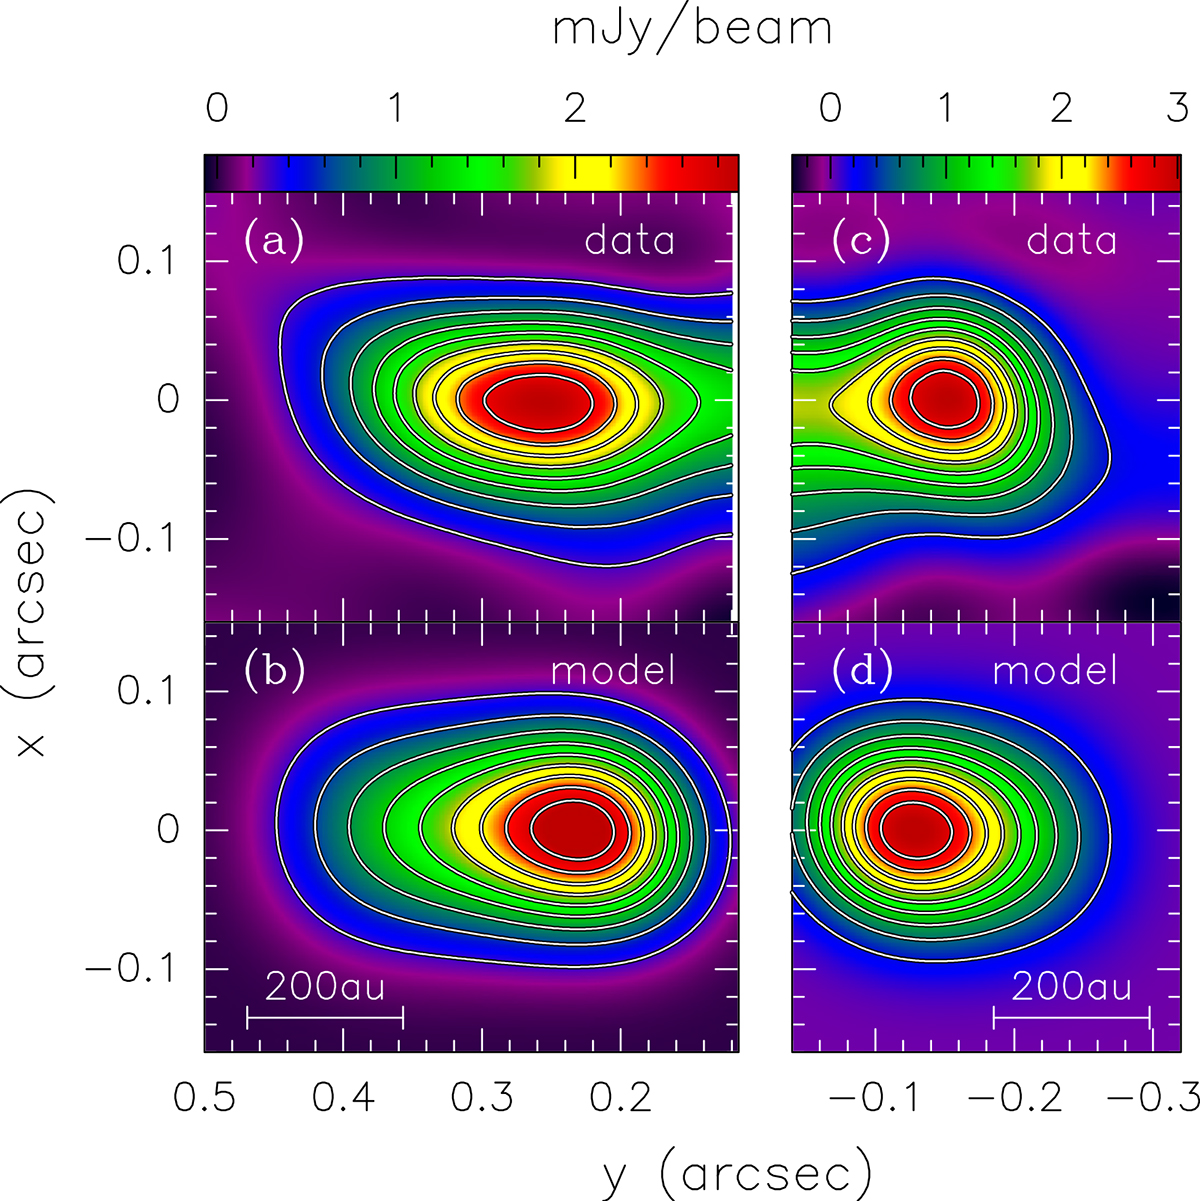
Comparison between observed and model maps of the 22.2 GHz continuum emission from the jet lobes. (a) Map of the NE lobe of the jet, rotated by 42° counterclockwise. Contour levels range from 10% to 90% in steps of 10% of the peak emission. (b) Best-fit model of the NE lobe. Contour levels are the same as for the data. (c) Same as panel a, but for the SW lobe, rotated by 48° counterclockwise. (d) Same as panel b, but for the SW lobe.
Current usage metrics show cumulative count of Article Views (full-text article views including HTML views, PDF and ePub downloads, according to the available data) and Abstracts Views on Vision4Press platform.
Data correspond to usage on the plateform after 2015. The current usage metrics is available 48-96 hours after online publication and is updated daily on week days.
Initial download of the metrics may take a while.