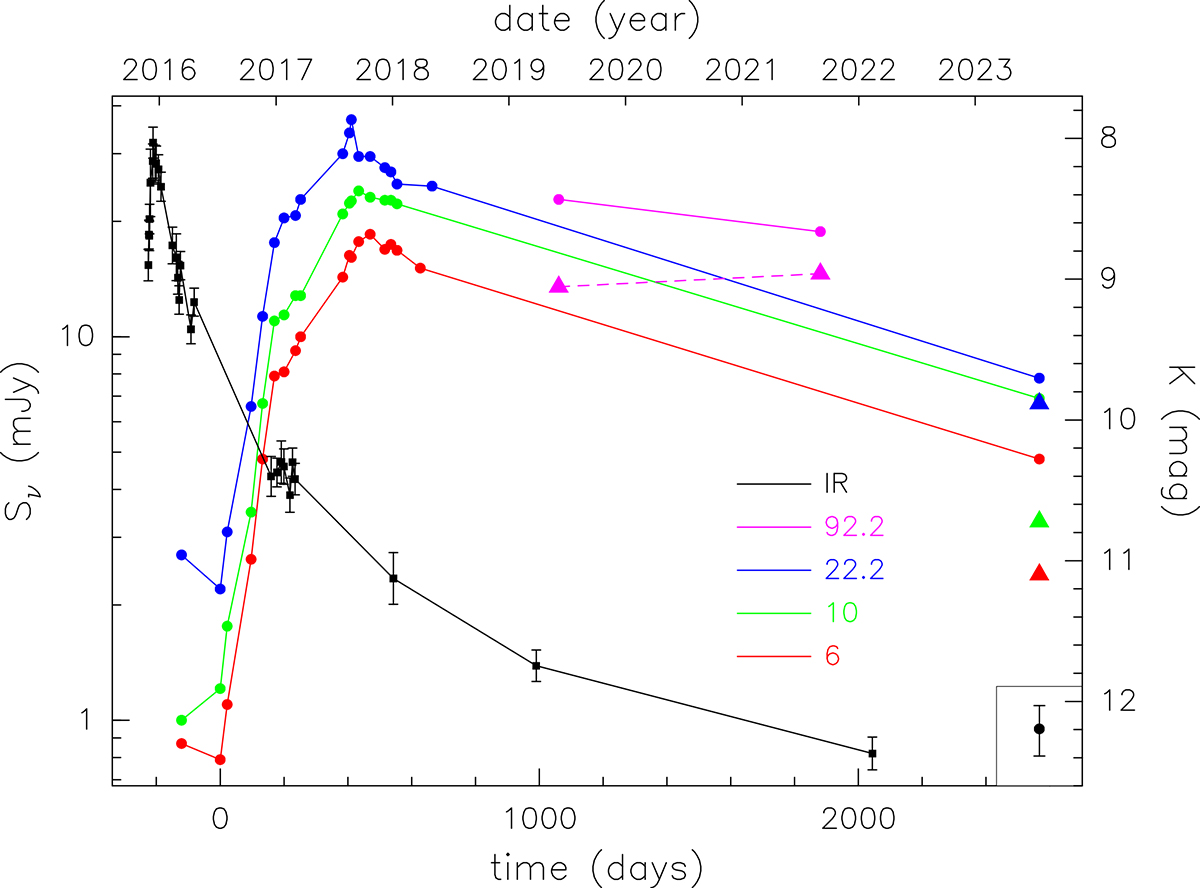
Fig. 4.
Download original image
Plot of the free-free continuum emission from the radio jet at 6, 10, and 22.2 GHz (coloured curves) as a function of time measured from the onset of the radio outburst on July 10, 2016 (see Paper I). Circles and solid lines indicate the emission from the NE lobe, while triangles and the dashed line denote the emission from the SW lobe. The error bar in the bottom right corresponds to an uncertainty of 15%. The black curve with error bars is the light curve of the accretion outburst obtained at K band in the near-infrared (see Fedriani et al. 2023).
Current usage metrics show cumulative count of Article Views (full-text article views including HTML views, PDF and ePub downloads, according to the available data) and Abstracts Views on Vision4Press platform.
Data correspond to usage on the plateform after 2015. The current usage metrics is available 48-96 hours after online publication and is updated daily on week days.
Initial download of the metrics may take a while.