Fig. 2.
Download original image
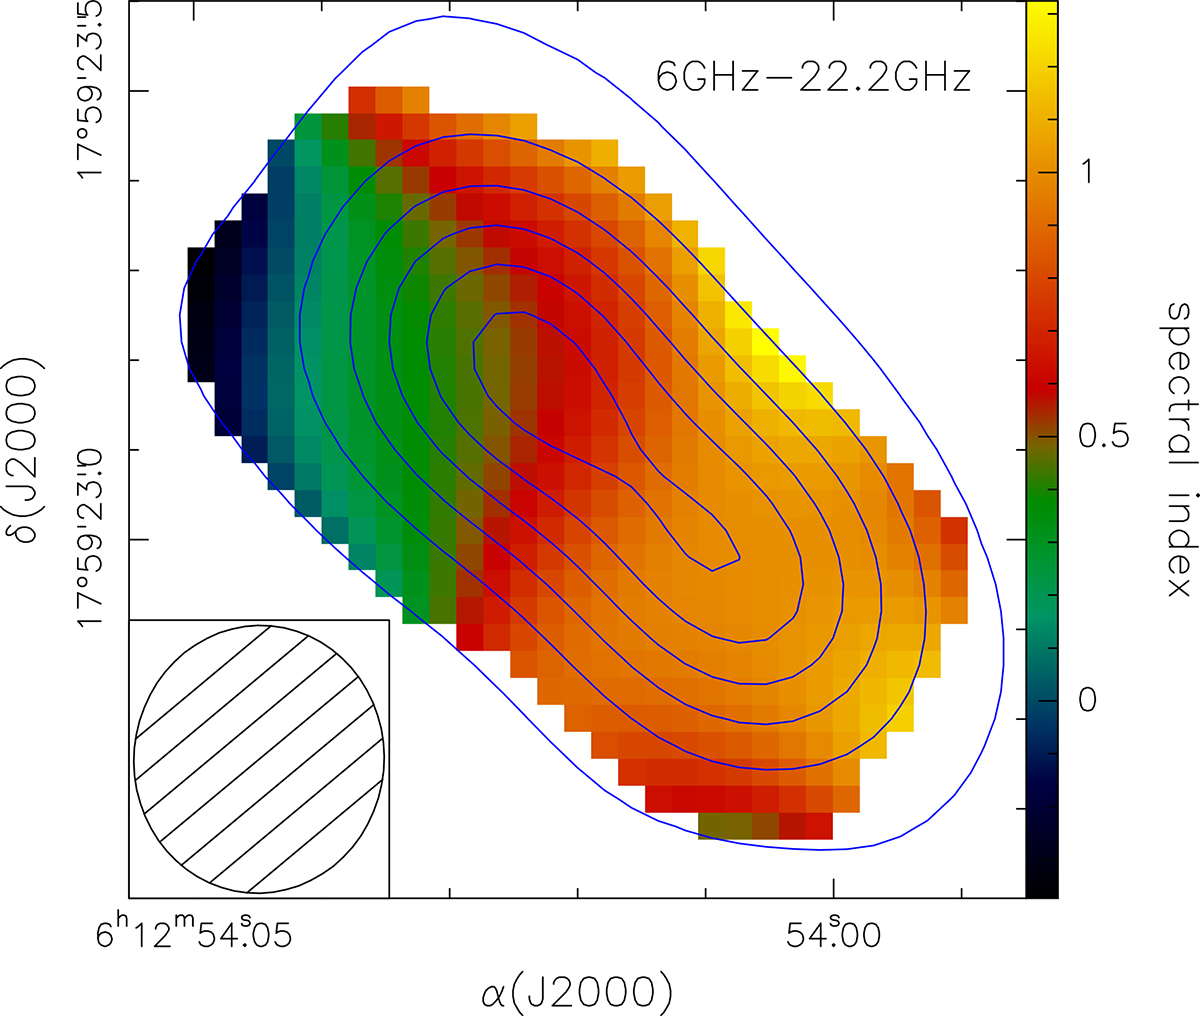
Map of the spectral index obtained from the ratio between the 6 GHz and 22.2 GHz images. The contours are a map of the 22.2 GHz continuum emission obtained with the same clean beam as the 6 GHz image. Contour levels range from 0.5 to 5.5 in steps of 1 mJy beam−1. The ellipse in the bottom right is the half-power width of the synthesised beam.
Current usage metrics show cumulative count of Article Views (full-text article views including HTML views, PDF and ePub downloads, according to the available data) and Abstracts Views on Vision4Press platform.
Data correspond to usage on the plateform after 2015. The current usage metrics is available 48-96 hours after online publication and is updated daily on week days.
Initial download of the metrics may take a while.