Fig. 1.
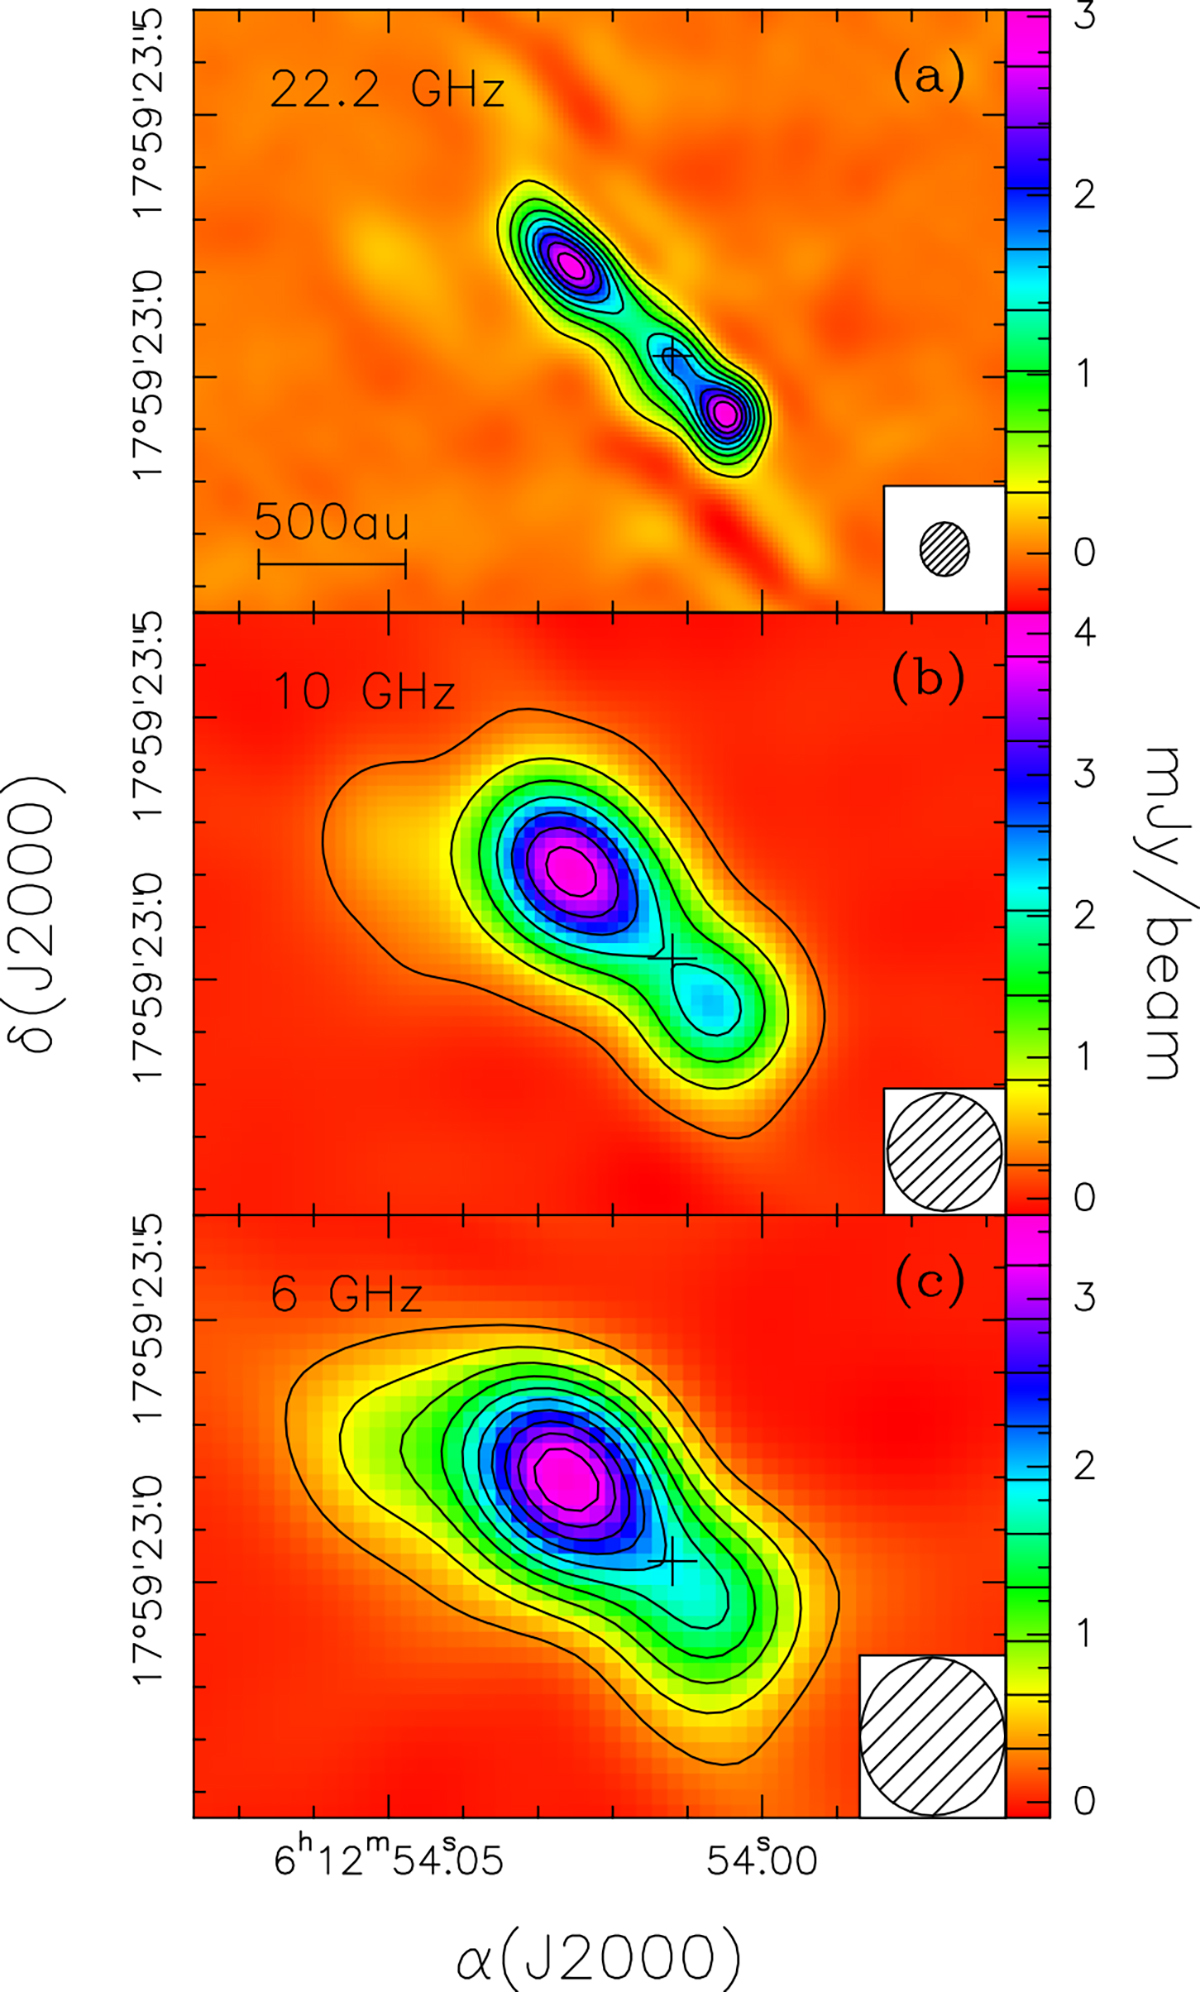
Download original image
Maps of the continuum emission from S255IR NIRS 3 obtained with the VLA. (a) Data acquired at 22.2 GHz on July 21, 2023. Contour levels are quantified by the colour scale to the right of the panel. The ellipse in the bottom right is the half-power width of the synthesised beam. The cross marks the peak of the 3 mm continuum emission from Paper II, which we assume to be the position of the star. (b) Same as top panel, but for the 10 GHz emission. c. Same as top panel, but for the 6 GHz emission.
Current usage metrics show cumulative count of Article Views (full-text article views including HTML views, PDF and ePub downloads, according to the available data) and Abstracts Views on Vision4Press platform.
Data correspond to usage on the plateform after 2015. The current usage metrics is available 48-96 hours after online publication and is updated daily on week days.
Initial download of the metrics may take a while.