| Issue |
A&A
Volume 683, March 2024
|
|
|---|---|---|
| Article Number | A94 | |
| Number of page(s) | 7 | |
| Section | Stellar structure and evolution | |
| DOI | https://doi.org/10.1051/0004-6361/202348466 | |
| Published online | 11 March 2024 | |
A two-dimensional perspective of the rotational evolution of rapidly rotating intermediate-mass stars
Implications for the formation of single Be stars
1
IRAP, Université de Toulouse, CNRS, UPS, CNES, 14 Avenue Édouard Belin, 31400 Toulouse, France
e-mail: This email address is being protected from spambots. You need JavaScript enabled to view it.
2
Space Research Group, University of Alcalá, 28871 Alcalá de Henares, Spain
Received:
2
November
2023
Accepted:
15
January
2024
Abstract
Context. Recently, the first successful attempt at computing stellar structure and evolution models in two dimensions was presented with models that include centrifugal deformation and self-consistently compute the velocity field.
Aims. The aim of the present study is to explore the rotational evolution of two-dimensional models of stars rotating at a significant fraction of their critical angular velocity. From the predictions of these models, we aim to improve our understanding of the formation of single Be stars.
Methods. Using the ESTER code, which solves the stellar structure of a rotating star in two dimensions with time evolution, we computed evolution tracks of stars of between 4 and 10 M⊙ for initial rotation rates ranging between 60 and 90% of the critical rotation rate. Furthermore, we compute models for both a Galactic metallicity and an SMC metallicity.
Results. A minimum initial rotation rate at the start of the main sequence is needed to spin up the star to critical rotation within its main sequence lifetime. This threshold depends on the stellar mass, and increases with increasing mass. The models do not predict any stars above 8 M⊙ to reach (near-)critical rotation during the main sequence. Furthermore, we find the minimum threshold of initial angular velocity is lower for SMC metallicity than for Galactic metallicity, which is in agreement with the increased fraction of observed Be stars in lower metallicity environments. The strong difference in the rotational evolution between different masses is not predicted by any one-dimensional stellar evolution models.
Conclusions. Our self-consistent two-dimensional stellar evolution models provide further insight into the rotational evolution of intermediate-mass stars, and our predictions are consistent with observations of velocity distributions and the fraction of Be stars amongst B-type stars. We find that stars with a mass above 8 M⊙ do not increase their fraction of critical rotation during the main sequence. As a fraction of stars above 8 M⊙ have been observed to display the Be phenomenon, other processes or formation channels must be at play, or, alternatively, critical rotation is not required for the Be phenomenon above this mass.
Key words: stars: emission-line / Be / stars: evolution / stars: interiors / stars: massive / stars: rotation
© The Authors 2024
 Open Access article, published by EDP Sciences, under the terms of the Creative Commons Attribution License (https://creativecommons.org/licenses/by/4.0), which permits unrestricted use, distribution, and reproduction in any medium, provided the original work is properly cited.
This article is published in open access under the Subscribe to Open model. This email address is being protected from spambots. You need JavaScript enabled to view it. to support open access publication.
1. Introduction
The rotational evolution of stars born with a convective core and radiative envelope is still a missing piece in the theory of stellar structure and evolution (SSE). As the rotation profile (or shear profile) of a star influences the efficiency of rotationally induced chemical mixing (e.g. Zahn 1992; Chaboyer & Zahn 1992), uncertainties in the predicted rotation profile in turn introduce uncertainties in the evolutionary pathway of the star in the Hertzsprung-Russell diagram (HRD). Studies using rotating stellar models are limited to one (spatial) dimension and the validity of such models for stars that are spinning at a significant fraction of their critical rotation rate is questionable. In Mombarg et al. (2023), we successfully ran the first two-dimensional SSE models of a 12 M⊙ star with the ESTER code (Espinosa Lara & Rieutord 2013; Rieutord et al. 2016). We calibrated our models with a β Cephei pulsator that has been well-characterised by Burssens et al. (2023) and we show that all observationally derived quantities such as luminosity, effective temperature, core mass, and core- and surface rotation, could be reproduced by the ESTER models.
Rotation also plays an important role in the formation of classical Be stars (Struve 1931), which we define here as stars of spectral type B that are rotating at sufficiently speeds to form a decretion disc. The formation of Be stars is not fully understood, and formation channels have been proposed including binary interaction (e.g. Kriz & Harmanec 1975; Pols et al. 1991) and single star evolution (Bodenheimer 1995; Ekström et al. 2008; Granada et al. 2013; Hastings et al. 2020). It is generally believed that the formation of a disc requires the star to spin at a large fraction of its critical angular velocity, but the exact limit is unknown and studies have argued that (near-) critical rotation is not a necessity for the Be phenomenon based on measured subcritical rotation rates. While Townsend et al. (2004) argue that the observed subcritical rotation rates are underestimated because gravity darkening (von Zeipel 1924) has not been properly taken into account, later studies accounting for this effect still find subcritical rotation rates (e.g. Cranmer 2005; Frémat et al. 2005). Moreover, Espinosa Lara & Rieutord (2011) showed that the von Zeipel law with an exponent of 0.25, as used by Townsend et al. (2004), overestimates the difference in effective temperature between the pole and the equator, further reducing the impact of gravity darkening on V sin i measurements.
The present paper follows up on the work of Mombarg et al. (2023). In this latter work, we discovered that a 12 M⊙ model never reaches a quasi-steady state, as it would if nuclear evolution were extremely slow. We found that the nuclear evolution of this model is too fast – especially near the end of the main sequence – for the baroclinic waves to be damped. Indeed, as shown by Busse (1981), the initial distribution of angular momentum of a star relaxes to a steady state when all baroclinic waves are damped out. This damping occurs on a timescale1 of trelax ∼ (R2/K)(N2/Ω2), which is equal to the thermal relaxation time R2/K (where R is the radius of the star and K the heat diffusivity) multiplied by the square ratio of the Brunt–Väisälä frequency N and the angular velocity Ω. If the nuclear evolution is much longer than this relaxation time then the evolution of the star can be computed as a series of steady states with the same total angular momentum (e.g. Gagnier et al. 2019a). In such a case, it has been shown that, provided the initial angular velocity is fast enough, and mass loss is negligible, the star inevitably reaches the critical rotation during the main sequence. The results of Mombarg et al. (2023) add detail to this simple picture, showing that nuclear evolution can be fast enough to prevent evolution in a series of relaxed quasi-steady states. The interesting conclusion is that even if initial angular velocity is high and mass loss unimportant, the star may not reach its critical angular velocity. This is a crucial point to investigate if we want to understand the Be phenomenon. Here, we therefore extend the investigations of Mombarg et al. (2023) to the broad mass range of intermediate-mass stars, namely 4 to 10 M⊙, where nuclear evolution is slower and possibly longer than the relaxation time of baroclinic waves. A comparison of timescales is not easy because parameters such as K, N, and Ω vary by orders of magnitude inside a star. We find that computation of the full evolution of 2D-ESTER models is the most direct way to get a broad view of the rotational evolution of these early-type stars, including the effects of metallicity.
The paper is organised as follows: in Sect. 2, we briefly describe the physics of the ESTER models that we use. In Sect. 3, we present the predicted evolution of the rotation velocity at the stellar surface and compare these predictions with the measured projected surface velocities of B-type stars by Huang et al. (2010). We discuss the effect of metallicity on the rotational evolution in Sect. 4, and finally present our conclusions in Sect. 5.
2. ESTER models
The study of Gagnier et al. (2019a) presents the rotational evolution of intermediate-mass stars using 2D ESTER2 models, where the chemical evolution is emulated with a succession of stationary models with the hydrogen mass fraction in the core given by
 (1)
(1)
where mp is the proton mass, Q the energy released per reaction, and ⟨ϵ⟩m is the mass-averaged nuclear energy production. The models of Gagnier et al. (2019a) do not account for the diffusion of material and therefore the composition remains constant throughout the entire radiative envelope. Moreover, these latter authors assume a time evolution along a series of quasi-steady states of the star. Here, we use the modified version of ESTER (r23.09.1-evol) – as presented in Mombarg et al. (2023) – that additionally solves for the chemical diffusion and fully takes into account the time-dependence of the structure of the star. Our physical setup is the same as that used by Mombarg et al. (2023), which we now briefly recapitulate.
Our models include chemical mixing induced by rotational shear. Indeed, an asteroseismic study of 26 slowly pulsating B-type stars (SPBs) by Pedersen et al. (2021) reveals that, for most stars, SSE models with rotational mixing provide a better solution to the observed gravity-mode pulsation periods than those with mixing by internal gravity waves. Moreover, a correlation was observed between the efficiency of chemical mixing and the rotation rate.
In ESTER, rotational mixing is based on the work of Zahn (1992) where the vertical diffusion coefficient scales with shear, n ⋅ ∇Ω (projection perpendicular to the isobars), and the heat diffusivity, K, namely
 (2)
(2)
Here,  is the volume-averaged value of the Brunt–Väisälä frequency in the radiative envelope and η is a free constant that we set to a value such that
  s2. This value prevents numerical issues due to steep chemical gradients building up during evolution. We fix the value of the horizontal chemical diffusion coefficient to 105 cm2 s−1.
Furthermore, in Espinosa Lara & Rieutord (2013) and Gagnier et al. (2019a), viscous effects are taken into account in the surface Ekman layers only, while in the new ESTER models used in the present analysis, viscous stresses are included throughout the star. This means we include a constant kinematic viscosity of ν = 107 cm2 s−1 in both the horizontal and vertical directions when we solve the angular momentum equation:
 (3)
(3)
where s is the distance to the rotation axis, v is the meridional velocity field, and ρ is density. We note that this choice for the kinematic viscosity was sufficient to reproduce the measured rotation profile of the β Cephei pulsator studied by Burssens et al. (2023) at the correct age, as demonstrated in Mombarg et al. (2023). As we limit ourselves to masses of ≤10 M⊙, we assume mass loss can be neglected.
The ESTER models are discretised in 12 domains, which are spheroidal shells separated by isobars (Rieutord et al. 2016). Figure 1 shows the distribution of angular momentum per domain for a 10 M⊙ star. From this figure, we can conclude that most of the star’s angular momentum is located in the deep interior and therefore any angular momentum extracted from the stellar surface via winds is extremely small in the mass regime we study here. As we do not assume solid-body rotation, the angular momentum loss at the surface is smaller that that predicted by 1D models such as the ones used by Hastings et al. (2020). In Appendix A, we show an example of a 2D rotation map at the zero-age main sequence (ZAMS), as well as 2D rotation maps for a model at the terminal-age main sequence (TAMS) and for a model rotating at the critical rotation rate. The Keplerian critical angular velocity that we use in this paper as the point of criticality is defined as
 (4)
(4)
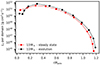 |
Fig. 1. Angular momentum integrated per domain as a function of the radial coordinate in the equatorial direction, once for a steady-state model (no viscous stresses), and once for the ESTER models used in this work. Both models are computed at Xcore/Xini = 0.12 and have a rotation rate of Ωeq/Ωc = 0.57. |
where Req is the radius at the equator. Gagnier et al. (2019b) showed that the reduction in Ωc due to the radiative acceleration at the stellar surface can be neglected in the mass regime we study here.
We investigate the rotational evolution for both a metallicity typical for stars in the Milky Way (MW, ZMW = 0.02) and a metallicity typical for stars in the Small Magellanic Cloud (SMC, ZSMC = 0.003). Lastly, we start our models at the ZAMS with a certain fraction of the critical angular velocity. These initial models are in a steady state, like those of Espinosa Lara & Rieutord (2013). Throughout this paper, the mentioned ages concern the time spent on the MS. Pre-MS lifetimes range from 4.4 Myr for 4 M⊙ to 0.34 Myr for 10 M⊙.
3. Evolution of rotation
We computed evolution tracks for masses of 4, 5, 6, 8, and 10 M⊙, all starting with an initial rotation rate of 75% of the critical rotation frequency3. As we do not take into account any physics for the formation of a circumstellar disc, we stop the models once critical rotation is reached. Table 1 lists the corresponding initial velocities at the equator.
Equatorial velocity at the ZAMS.
3.1. Model predictions
The evolution tracks in the HRD are shown in Fig. 2 for the effective temperature at the pole and at the equator. It should be noted that for stars close to the critical rotation limit, the difference between the effective temperature at the pole and equator can differ by as much as a factor of two. The hooks seen at the end of some evolution tracks are the result of core contraction due to the steep drop in hydrogen in the convective core. Some models were stopped before the hook due to numerical problems. The hook seen in the equatorial Teff track for the 6 M⊙ model in the right panel of Fig. 2 is the result of the star reaching near-critical rotation for a brief moment but then decreasing the fraction of critical rotation again. For the ZSMC case, we also show the 1D rotating evolution tracks from Georgy et al. (2013, not available for ZMW = 0.02 as we assume in this paper). In general, the Teff predicted from the 1D rotating models is the average of the polar and equatorial Teff predicted by our ESTER models. The 1D models remain below Ω/Ωc = 0.8, while our 2D models predict stars of below 8 M⊙ to reach critical rotation during the main sequence.
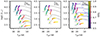 |
Fig. 2. Hertzsprung-Russell diagram showing the evolution of the ESTER models, colour-coded by the fraction of critical rotation. For each mass, a track is plotted once using the effective temperature at the pole and once using the effective temperature at the equator. The left (right) colour bar corresponds to the pole (equator). For comparison, non-rotating MESA (r23.05.1; Paxton et al. 2011, 2013, 2015, 2018, 2019; Jermyn et al. 2023) tracks are shown with the grey lines. The MESA tracks were computed up to the base of the red giant branch, whereas the ESTER tracks are stopped close to the TAMS or when critical rotation is reached. In the right panel, rotating 1D models (same initial rotation) from Georgy et al. (2013) are also shown in blue. |
Figure 3 shows the evolution of the fraction of critical rotation Ωeq/Ωc as a function of time spent on the main sequence and as a function of the hydrogen mass fraction in the core (Xc). We note several interesting findings. We find that for (Ωeq/Ωc)i = 0.75, the stars of 4, 5, and 6 M⊙ increase their fraction of critical rotation during the MS. While the 6 M⊙ star spins down4 after about 45 Myr when it reaches a maximum of Ωeq/Ωc = 0.84, the 4 M⊙ and 5 M⊙ models continue to spin up and reach critical rotation around 77 Myr and 64 Myr, respectively. Our models for 8 and 10 M⊙ predict a continuous decrease in the fraction of critical rotation during the MS.
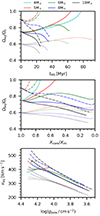 |
Fig. 3. Evolution of the fraction of critical rotation as a function of time spent on the MS (top panel) and as a function of the mass fraction of hydrogen in the core with respect to the initial mass fraction (middle panel). The bottom panel shows the velocity at the equator as a function of the surface gravity at the pole. The different line styles correspond to the different initial rotation rates at the start of the MS. The models shown here are for ZMW. |
Additionally, we ran models starting at 90% of the initial critical rotation frequency. At this very high initial rotation rate, the 5 M⊙ star reaches critical rotation after roughly 22 Myr, and the 6 M⊙ star now also spins up to critical rotation only a few million years later. In case of a 8 M⊙ star, even an initial rotation rate of as high as (Ωeq/Ωc)i = 0.9 is not sufficient to reach critical rotation during the MS, and the star spins down and reaches Ωeq/Ωc = 0.7 near the end. Finally, we also tested whether an initial rotation rate of 60% of the critical rotation is still sufficient to spin up a 5 M⊙ star to criticality. As can been seen in Fig. 3 (red dotted line), the star reaches a maximum of roughly Ωeq/Ωc = 0.7 and then spins down. In summary, the threshold on the minimum initial rotation rate needed to reach critical rotation during the MS decreases with decreasing mass.
3.2. Uncertainties from chemical mixing
As mentioned before, the feedback of a chemical gradient on the efficiency of chemical diffusion is not taken into account in the ESTER models and Eq. (2) has a free parameter. In Mombarg et al. (2023), we show that this description of chemical mixing indeed reproduces the measured core mass by Burssens et al. (2023). The choice for the value of η will influence the exact age at which the star reaches critical rotation. More efficient mixing will result in a larger convective core and a slightly larger radiative envelope, thereby increasing the timescale on which baroclinic modes are damped and angular momentum is redistributed (Eq. (3) in Mombarg et al. 2023). We recomputed the evolution track of the (5 M⊙, (Ωeq/Ωc)i = 0.75, ZMW) model, where we changed η = 1.85 to 1. Such a change in the global scaling of the vertical diffusion coefficient increases the time to reach criticality to 67 Myr, which is a prolongation of 3 Myr (see Appendix B). Therefore, our conclusions remain the same for changes to the value of η that are of order unity.
3.3. Comparision with observations
The work of Huang et al. (2010) presents the V sin i/Vc distribution5 of a large sample of cluster and field B-type stars according to the spectroscopic surface gravity at the rotational pole, log gpole (Be stars excluded). These authors find that stars of between 2 and 4 M⊙ have larger values for V sin i/Vc on average than stars of between 7 and 13 M⊙. In Fig. 4, we show Veq/Vc averaged over the MS lifetime (or the time until critical rotation is reached) for each mass, computed from the 2D ESTER models for ZMW. The points are normalised to the initial value at the ZAMS, (Veq/Vc)i. We observe a decrease in ⟨Veq/Vc⟩/(Veq/Vc)i with respect to the stellar mass that has a similar slope compared to the upper limits of Veq/Vc derived by Huang et al. (2010) for non-emission B-type stars (grey points in Fig. 4). In other words, observations show that the upper limit on Veq/Vc decreases with mass, while our models show the same trend once Veq/Vc is rescaled by its initial value at the ZAMS. This latter rescaling could be avoided by running a large set of models representing the evolution of a star cluster and computing the maximum angular velocity per bin of mass, but such a simulation is presently too demanding in terms of computing time.
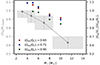 |
Fig. 4. Average value of the equatorial velocity with respect to the critical one, ⟨Veq/Vc⟩, divided by the initial value at the ZAMS, as a function of stellar mass. Data points in grey show the observationally derived upper limits of Veq/Vc taken from the last column of Table 7 of Huang et al. (2010). |
4. Effect of metallicity
We also computed evolution tracks for the same masses with a metallicity typical of the SMC. The results are shown in Fig. 5. We find that at lower metallicities, the stars spin up faster, and the 5 M⊙ star reaches critical rotation around 40 Myr, whereas for Galactic metallicity, this would take 63 Myr. Similarly, the 5 M⊙ star starting with (Ωeq/Ωc)i = 0.9 reaches critical rotation after 13 Myr at SMC metallicity, whereas it takes 22 Myr at MW metallicity. Moreover, the lower metallicity is sufficient to also spin up the 6 M⊙ star to (near-)critical rotation around 45 Myr. As the timescale on which baroclinic modes are damped scales with the square of the thickness of the radiative envelope (Busse 1981), we expect angular momentum to be more quickly redistributed in lower-metallicity stars as they are more compact. On the other hand, the nuclear timescale also decreases with decreasing metallicity, because lower metallicity results in higher central temperatures. Nonetheless, we find that for the 5 M⊙ ZAMS model, the baroclinic timescale differs by 150% between ZMW and ZSMC, while the nuclear timescale only differs by 25%. Likewise, for the 10 M⊙ ZAMS model, the difference in the baroclinic timescale is 50%, compared to 14% for the nuclear timescale. Again, our models predict no stars of ≥8 M⊙ that significantly increase the fraction of critical rotation compared to their initial value when (Ωeq/Ωc)i is equal to 0.75. Also, even at SMC metallicity, the spin up of the 5 M⊙ star starting with (Ωeq/Ωc)i = 0.6 stalls after 60 Myr, having reached a maximum of Ωeq/Ωc = 0.7.
It is interesting to note that our 2D models suggest an increase in the fraction of Be stars with decreasing metallicity. Indeed, larger fractions of Be stars have been observed in lower metallicity environments (Martayan et al. 2010; Iqbal & Keller 2013), but this is not reproduced by the 1D models by Ekström et al. (2008, 2012) and Granada et al. (2013). The predictions of Hastings et al. (2020, also based on 1D models) do predict this observed relation between the fraction of Be stars and metallicity, but in their models, this is due to the dependence of the mass-loss rate on the metallicity. Therefore, this should only be of importance in more massive stars, namely those of above 10 M⊙, while we find a strong metallicity effect also at lower masses and we do not account for mass loss.
5. Conclusions
Following the successful calibration of the first 2D stellar structure and evolution models by Mombarg et al. (2023), we present rotating stellar evolution tracks for intermediate-mass stars computed with the 2D ESTER code. Solving the stellar structure in two dimensions instead of one, we are now able to account for the centrifugal deformation of the star, and we compute the rotation profile self-consistently from the baroclinic torque (e.g. Eq. (26) in Espinosa Lara & Rieutord 2013). We present evolution models for stellar masses of 4, 5, 6, 8, and 10 M⊙ for initial rotation rates of between 60 and 90% of the critical angular velocity. In summary, the most important findings from our 2D models are the following.
-
An initial rotation rate of (Ωeq/Ωc)i = 0.75 is not enough for stars with masses of ≥6 M⊙ and galactic metallicity to evolve towards critical rotation. Stars of 5 M⊙ will reach critical rotation at around 60 Myr of age.
-
At an initial rotation rate of (Ωeq/Ωc)i = 0.9, stars of 5 and 6 M⊙ are indeed able to reach critical rotation at around 20−25 Myr.
-
Stars in the SMC, and therefore with a lower metallicity than Galactic stars, spin up faster and stars with masses 5 and 6 M⊙ can reach critical rotation around at 40 Myr.
-
Stars with masses of ≥8 M⊙ always move away from critical rotation during the main sequence, even for SMC metallicity or (Ωeq/Ωc)i = 0.9.
If we assume that the emergence of the Be phenomenon requires the star to rotate close to criticality, we can make the following predictions for the fraction of single Be stars with respect to the total number of B-type stars. First, if we hypothesise that single Be stars are born as rapid rotators, then our models show that the minimum initial rotation rate needed to spin up stars to criticality decreases with decreasing metallicity. Second, our models predict that no stars with a mass of above 8 M⊙ can continue to rotate at or near critical rotation. We therefore conclude that for massive B-type stars of ≳8 M⊙, the velocity threshold above which matter is expelled from the surface must be lower than for lower-mass stars.
In order to constrain the prevalence of the single-star formation channel compared to the binary formation channel, the upper limit on the fraction of critical rotation at which material can be expelled from the surface (for a given stellar mass) needs to be quantified. Additionally, while the predicted rotation profile from ESTER is in agreement with the observed one in the case of the β Cephei pulsator HD 192575 (Mombarg et al. 2023), future measurements of rotation profiles of massive stars with a precise mass and age will help to provide a better picture of the accuracy of the current treatment of angular momentum transport.
Here, we limit ourselves to masses up to 10 M⊙, but we expect the more massive B-type stars that weigh up to 16 M⊙ to also decrease the fraction of critical rotation during the MS. Assuming the mass-loss rate predicted by Björklund et al. (2021), a 16 M⊙ has lost about 0.02 M⊙ by the point of core-hydrogen exhaustion (or about a factor 10 more when assuming the mass-loss rate of Vink et al. 2001). Hence, the decrease in the value of Ωc due to mass loss is negligible. Moreover, Gagnier et al. (2019b) demonstrated that the reduction in the critical rotation velocity due to radiative acceleration is small for stars below 40 M⊙. However, the decrease in Ωeq/Ωc with respect to time can be accelerated as a result of angular-momentum loss at the stellar surface (Gagnier et al. 2019a). While we expect this effect to be small, further study of 2D evolution with mass loss is required to quantify this.
Observed fractions of Be stars compared to the total number of B-type stars in clusters show little increase over time (McSwain & Gies 2005). In light of our results for single stars, this implies that the majority of stars are born with a rotation rate of ≲60% of the critical angular velocity at the ZAMS. The higher fraction of Be stars in low-metallicity environments observed around an age of 40 Myr (Martayan et al. 2010) is in line with our predictions, as we predict a lower threshold on the initial rotation required for stars to reach critical rotation and predict that a smaller time span is required to do so. Furthermore, the predicted evolution of the surface velocity by the ESTER models seems to be in good agreement with the measurements of the fastest rotating B-type stars in the sample of Huang et al. (2010).
In summary, the results of two-dimensional stellar structure and evolution models that include differential rotation and meridional currents show the limitations of one-dimensional models in predicting the evolution of rapidly rotating stars. In addition to the (projected) velocity at the surface, the surface abundance of the nitrogen-14 isotope is also a useful observable with which to test the theory of rotational evolution in massive stars. In stars that are undergoing hydrogen burning via the CNO cycle, an overabundance of nitrogen is created in the core and the enhancement of its abundance at the surface is indicative of the efficiency of chemical (rotational) mixing (e.g. Hunter et al. 2009; Brott et al. 2011). In a future paper, we will investigate the evolution of surface abundances predicted from rotational mixing with 2D evolution models.
This timescale is sometimes related to the Eddington-Sweet timescale, but see the discussion of Rieutord (2006).
All models presented in this paper are available on https://doi.org/10.5281/zenodo.10411194
In this paper, the term “spinning down/up” refers to the evolution of the fraction of critical angular velocity, not to the real angular velocity. The actual angular velocity decreases as the star evolves, but the critical angular velocity may decrease even faster, moving the star closer to critical angular velocity. We refer to this motion towards criticality as “spin-up”.
The critical rotation velocity is estimated from the Roche model.
Acknowledgments
The research leading to these results has received funding the French Agence Nationale de la Recherche (ANR), under grant MASSIF (ANR-21-CE31-0018-02). M.R. also acknowledges the support from the Centre National d’Etudes Spatiales (CNES) and from the European Research Council (ERC) under the Horizon Europe programme (Synergy Grant agreement N°101071505: 4D-STAR). Computations of ESTER 2D-models have been possible thanks to HPC resources from CALMIP supercomputing center (Grant 2023-P0107). While partially funded by the European Union, views and opinions expressed are however those of the authors only and do not necessarily reflect those of the European Union or the European Research Council. Neither the European Union nor the granting authority can be held responsible for them. The authors are thankful for the feedback on the manuscript provided by the anonymous referee.
References
- Björklund, R., Sundqvist, J. O., Puls, J., & Najarro, F. 2021, A&A, 648, A36 [EDP Sciences] [Google Scholar]
- Bodenheimer, P. 1995, ARA&A, 33, 199 [NASA ADS] [CrossRef] [Google Scholar]
- Brott, I., Evans, C. J., Hunter, I., et al. 2011, A&A, 530, A116 [NASA ADS] [CrossRef] [EDP Sciences] [Google Scholar]
- Burssens, S., Bowman, D. M., Michielsen, M., et al. 2023, Nat. Astron., 7, 1138 [NASA ADS] [CrossRef] [Google Scholar]
- Busse, F. 1981, Geophys. Astrophys. Fluid Dyn., 17, 215 [Google Scholar]
- Chaboyer, B., & Zahn, J. P. 1992, A&A, 253, 173 [NASA ADS] [Google Scholar]
- Cranmer, S. R. 2005, ApJ, 634, 585 [NASA ADS] [CrossRef] [Google Scholar]
- Ekström, S., Meynet, G., Maeder, A., & Barblan, F. 2008, A&A, 478, 467 [Google Scholar]
- Ekström, S., Georgy, C., Eggenberger, P., et al. 2012, A&A, 537, A146 [Google Scholar]
- Espinosa Lara, F., & Rieutord, M. 2011, A&A, 533, A43 [NASA ADS] [CrossRef] [EDP Sciences] [Google Scholar]
- Espinosa Lara, F., & Rieutord, M. 2013, A&A, 552, A35 [NASA ADS] [CrossRef] [EDP Sciences] [Google Scholar]
- Frémat, Y., Zorec, J., Hubert, A. M., & Floquet, M. 2005, A&A, 440, 305 [NASA ADS] [CrossRef] [EDP Sciences] [Google Scholar]
- Gagnier, D., Rieutord, M., Charbonnel, C., Putigny, B., & Espinosa Lara, F. 2019a, A&A, 625, A89 [NASA ADS] [CrossRef] [EDP Sciences] [Google Scholar]
- Gagnier, D., Rieutord, M., Charbonnel, C., Putigny, B., & Espinosa Lara, F. 2019b, A&A, 625, A88 [NASA ADS] [CrossRef] [EDP Sciences] [Google Scholar]
- Georgy, C., Ekström, S., Eggenberger, P., et al. 2013, A&A, 558, A103 [NASA ADS] [CrossRef] [EDP Sciences] [Google Scholar]
- Granada, A., Ekström, S., Georgy, C., et al. 2013, A&A, 553, A25 [NASA ADS] [CrossRef] [EDP Sciences] [Google Scholar]
- Hastings, B., Wang, C., & Langer, N. 2020, A&A, 633, A165 [NASA ADS] [CrossRef] [EDP Sciences] [Google Scholar]
- Huang, W., Gies, D. R., & McSwain, M. V. 2010, ApJ, 722, 605 [Google Scholar]
- Hunter, I., Brott, I., Langer, N., et al. 2009, A&A, 496, 841 [NASA ADS] [CrossRef] [EDP Sciences] [Google Scholar]
- Iqbal, S., & Keller, S. C. 2013, MNRAS, 435, 3103 [NASA ADS] [CrossRef] [Google Scholar]
- Jermyn, A. S., Bauer, E. B., Schwab, J., et al. 2023, ApJS, 265, 15 [NASA ADS] [CrossRef] [Google Scholar]
- Kriz, S., & Harmanec, P. 1975, Bull. Astron. Inst. Czechoslov., 26, 65 [Google Scholar]
- Martayan, C., Baade, D., & Fabregat, J. 2010, A&A, 509, A11 [NASA ADS] [CrossRef] [EDP Sciences] [Google Scholar]
- McSwain, M. V., & Gies, D. R. 2005, ApJS, 161, 118 [Google Scholar]
- Mombarg, J. S. G., Rieutord, M., & Espinosa Lara, F. 2023, A&A, 677, L5 [NASA ADS] [CrossRef] [EDP Sciences] [Google Scholar]
- Paxton, B., Bildsten, L., Dotter, A., et al. 2011, ApJS, 192, 3 [Google Scholar]
- Paxton, B., Cantiello, M., Arras, P., et al. 2013, ApJS, 208, 4 [Google Scholar]
- Paxton, B., Marchant, P., Schwab, J., et al. 2015, ApJS, 220, 15 [Google Scholar]
- Paxton, B., Schwab, J., Bauer, E. B., et al. 2018, ApJS, 234, 34 [NASA ADS] [CrossRef] [Google Scholar]
- Paxton, B., Smolec, R., Schwab, J., et al. 2019, ApJS, 243, 10 [Google Scholar]
- Pedersen, M. G., Aerts, C., Pápics, P. I., et al. 2021, Nat. Astron., 5, 715 [NASA ADS] [CrossRef] [Google Scholar]
- Pols, O. R., Cote, J., Waters, L. B. F. M., & Heise, J. 1991, A&A, 241, 419 [NASA ADS] [Google Scholar]
- Rieutord, M. 2006, in Stellar Fluid Dynamics and Numerical Simulations: From the Sun to Neutron Stars, eds. M. Rieutord, & B. Dubrulle (EAS), 21, 275 [Google Scholar]
- Rieutord, M., Espinosa Lara, F., & Putigny, B. 2016, J. Comput. Phys., 318, 277 [NASA ADS] [CrossRef] [Google Scholar]
- Struve, O. 1931, ApJ, 73, 94 [Google Scholar]
- Townsend, R. H. D., Owocki, S. P., & Howarth, I. D. 2004, MNRAS, 350, 189 [Google Scholar]
- Vink, J. S., de Koter, A., & Lamers, H. J. G. L. M. 2001, A&A, 369, 574 [NASA ADS] [CrossRef] [EDP Sciences] [Google Scholar]
- von Zeipel, H. 1924, MNRAS, 84, 665 [NASA ADS] [CrossRef] [Google Scholar]
- Zahn, J. P. 1992, A&A, 265, 115 [NASA ADS] [Google Scholar]
Appendix A: 2D rotation maps
This Appendix shows the 2D maps of the angular rotation velocity for a 5 M⊙ model at the ZAMS, a 5 M⊙ model when it reaches critical rotation, and a 6 M⊙ model near TAMS. The rotation map of the 6 M⊙ model at the ZAMS (not shown) is very similar to that of the 5 M⊙ model.
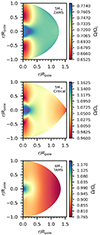 |
Fig. A.1. Two-dimensional maps of the angular rotation velocity with respect to the Keplerian critical rotation velocity. |
Appendix B: Influence of chemical mixing
This Appendix shows the influence of the chemical mixing parameter η on the rotational evolution.
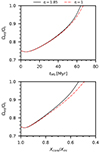 |
Fig. B.1. Evolution of the fraction of critical rotation as a function of time spent on the MS (top panel) and as a function of the mass fraction of hydrogen in the core with respect to the initial mass fraction. The different line styles correspond to different global scalings of the vertical diffusion coefficient predicted from rotational mixing (Eq. 2). The models are shown for a 5 M⊙ star with ZMW. |
All Tables
All Figures
|
Fig. 1. Angular momentum integrated per domain as a function of the radial coordinate in the equatorial direction, once for a steady-state model (no viscous stresses), and once for the ESTER models used in this work. Both models are computed at Xcore/Xini = 0.12 and have a rotation rate of Ωeq/Ωc = 0.57. |
| In the text | |
|
Fig. 2. Hertzsprung-Russell diagram showing the evolution of the ESTER models, colour-coded by the fraction of critical rotation. For each mass, a track is plotted once using the effective temperature at the pole and once using the effective temperature at the equator. The left (right) colour bar corresponds to the pole (equator). For comparison, non-rotating MESA (r23.05.1; Paxton et al. 2011, 2013, 2015, 2018, 2019; Jermyn et al. 2023) tracks are shown with the grey lines. The MESA tracks were computed up to the base of the red giant branch, whereas the ESTER tracks are stopped close to the TAMS or when critical rotation is reached. In the right panel, rotating 1D models (same initial rotation) from Georgy et al. (2013) are also shown in blue. |
| In the text | |
|
Fig. 3. Evolution of the fraction of critical rotation as a function of time spent on the MS (top panel) and as a function of the mass fraction of hydrogen in the core with respect to the initial mass fraction (middle panel). The bottom panel shows the velocity at the equator as a function of the surface gravity at the pole. The different line styles correspond to the different initial rotation rates at the start of the MS. The models shown here are for ZMW. |
| In the text | |
|
Fig. 4. Average value of the equatorial velocity with respect to the critical one, ⟨Veq/Vc⟩, divided by the initial value at the ZAMS, as a function of stellar mass. Data points in grey show the observationally derived upper limits of Veq/Vc taken from the last column of Table 7 of Huang et al. (2010). |
| In the text | |
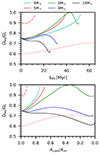 |
Fig. 5. Same as Fig. 3, but for ZSMC. |
| In the text | |
|
Fig. A.1. Two-dimensional maps of the angular rotation velocity with respect to the Keplerian critical rotation velocity. |
| In the text | |
|
Fig. B.1. Evolution of the fraction of critical rotation as a function of time spent on the MS (top panel) and as a function of the mass fraction of hydrogen in the core with respect to the initial mass fraction. The different line styles correspond to different global scalings of the vertical diffusion coefficient predicted from rotational mixing (Eq. 2). The models are shown for a 5 M⊙ star with ZMW. |
| In the text | |
Current usage metrics show cumulative count of Article Views (full-text article views including HTML views, PDF and ePub downloads, according to the available data) and Abstracts Views on Vision4Press platform.
Data correspond to usage on the plateform after 2015. The current usage metrics is available 48-96 hours after online publication and is updated daily on week days.
Initial download of the metrics may take a while.