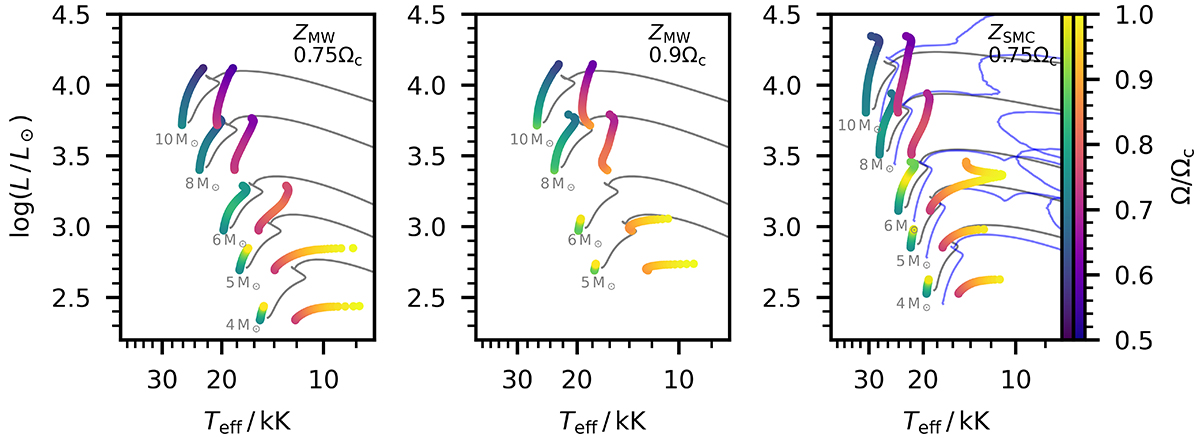
Fig. 2.
Download original image
Hertzsprung-Russell diagram showing the evolution of the ESTER models, colour-coded by the fraction of critical rotation. For each mass, a track is plotted once using the effective temperature at the pole and once using the effective temperature at the equator. The left (right) colour bar corresponds to the pole (equator). For comparison, non-rotating MESA (r23.05.1; Paxton et al. 2011, 2013, 2015, 2018, 2019; Jermyn et al. 2023) tracks are shown with the grey lines. The MESA tracks were computed up to the base of the red giant branch, whereas the ESTER tracks are stopped close to the TAMS or when critical rotation is reached. In the right panel, rotating 1D models (same initial rotation) from Georgy et al. (2013) are also shown in blue.
Current usage metrics show cumulative count of Article Views (full-text article views including HTML views, PDF and ePub downloads, according to the available data) and Abstracts Views on Vision4Press platform.
Data correspond to usage on the plateform after 2015. The current usage metrics is available 48-96 hours after online publication and is updated daily on week days.
Initial download of the metrics may take a while.