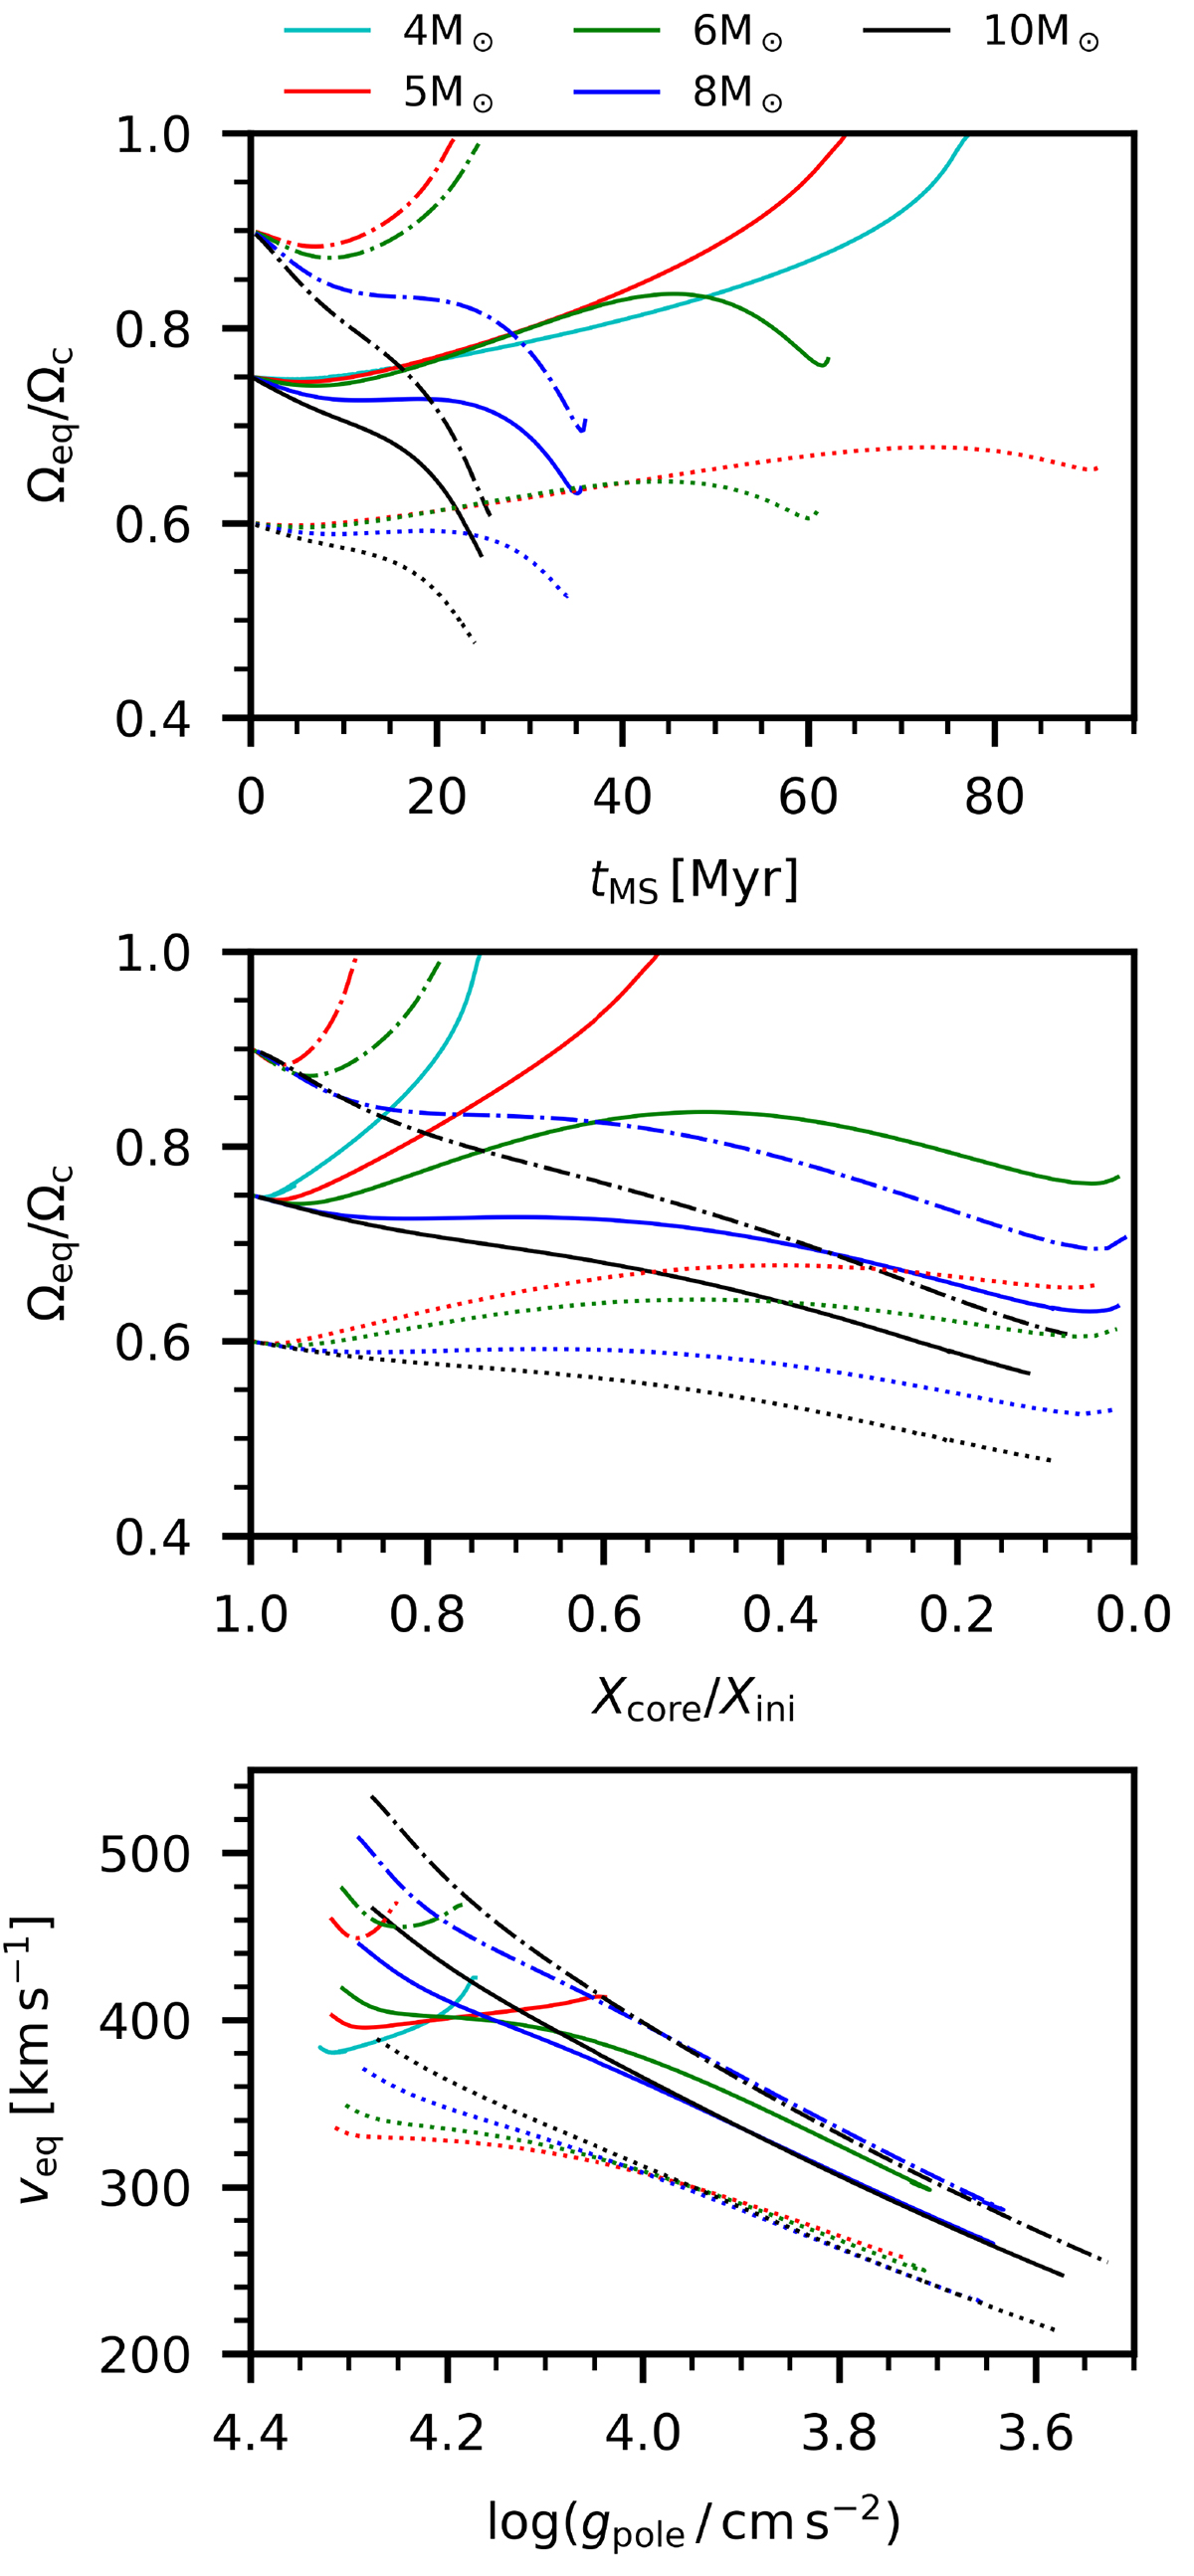
Fig. 3.
Download original image
Evolution of the fraction of critical rotation as a function of time spent on the MS (top panel) and as a function of the mass fraction of hydrogen in the core with respect to the initial mass fraction (middle panel). The bottom panel shows the velocity at the equator as a function of the surface gravity at the pole. The different line styles correspond to the different initial rotation rates at the start of the MS. The models shown here are for ZMW.
Current usage metrics show cumulative count of Article Views (full-text article views including HTML views, PDF and ePub downloads, according to the available data) and Abstracts Views on Vision4Press platform.
Data correspond to usage on the plateform after 2015. The current usage metrics is available 48-96 hours after online publication and is updated daily on week days.
Initial download of the metrics may take a while.