Fig. 4.
Download original image
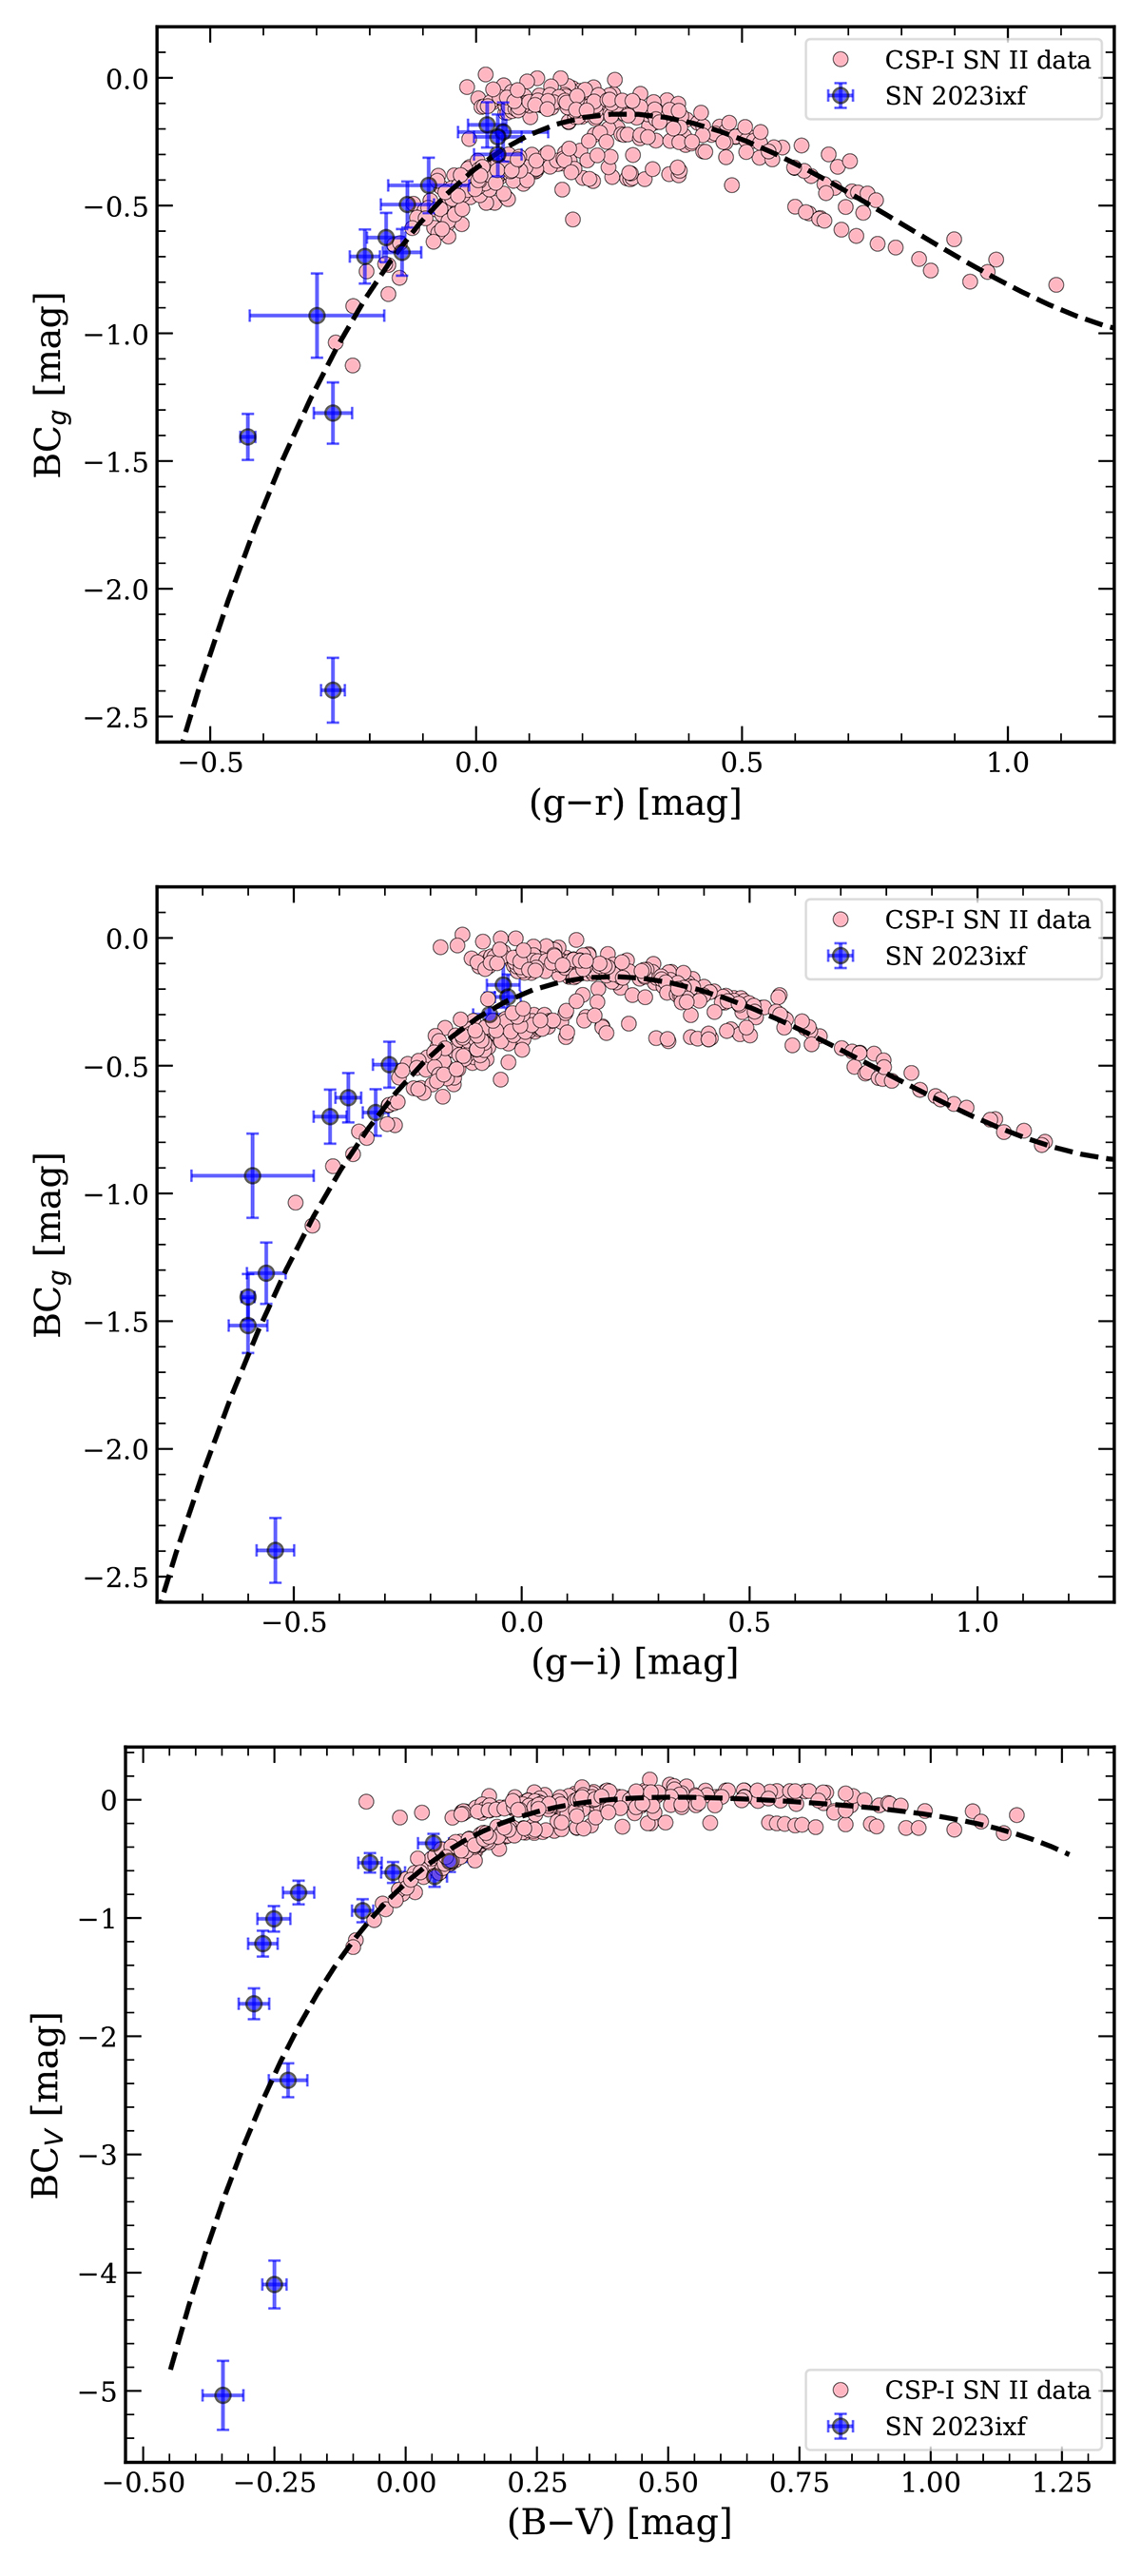
Bolometric corrections relative to the g band as a function of (g − r) colour (top panel) and (g − i) colour (middle panel), and relative to the V band as a function of (B − V) colour (bottom panel). SN 2023ixf is presented as blue dots, while pink dots represent the cooling phase of the SNe II in the CSP-I sample (see Martinez et al. 2022a). The dashed lines shows the fit to the data. The errors in the CSP-I SN II data are not plotted for better visualisation.
Current usage metrics show cumulative count of Article Views (full-text article views including HTML views, PDF and ePub downloads, according to the available data) and Abstracts Views on Vision4Press platform.
Data correspond to usage on the plateform after 2015. The current usage metrics is available 48-96 hours after online publication and is updated daily on week days.
Initial download of the metrics may take a while.